
Fig. 5
- ID
- ZDB-FIG-220623-16
- Publication
- Papadaki et al., 2022 - Dual-expression system for blue fluorescent protein optimization
- Other Figures
- All Figure Page
- Back to All Figure Page
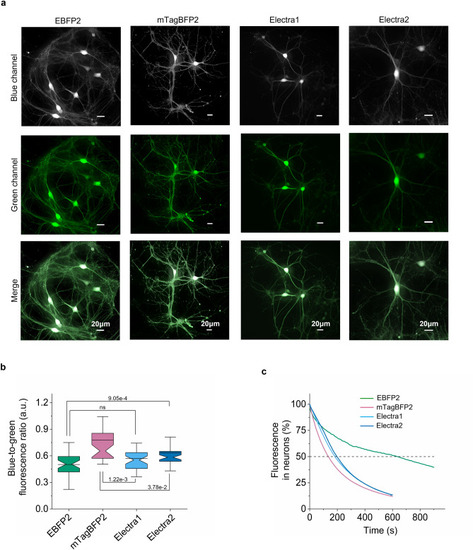
Characterization of Electra variants in cultured neurons. (a) Representative images of hippocampal neurons at DIV14 co-expressing EBFP2, mTagBFP2, Electra1, or Electra2 under human synapsin promoter with EGFP via P2A self-cleaving peptide. BFPs are shown in grey; EGFP in green (n = 35, 37, 38, 40 respectively, from 2 independent rAAV2/9 transductions each; imaging conditions for BFPs: 403 nm excitation; 456 nm emission; 0.91 mW/mm2; z-stack max projection; image deconvolution using NIS Elements online deconvolution tool). The dynamic range of all images was adjusted independently to facilitate visualization. (b) Quantification of blue-to-green fluorescence ratio in live hippocampal neurons (n = 35, 37, 38, 40 neurons for EBFP2, mTagBFP2, Electra1, Electra2, respectively, from 2 independent transductions each; Kruskal–WaNllis ANOVA p-value = 4.66e-8; post-hoc two sample Kolmogorov-Smirnoff p-values shown in graph; Supplementary Table S6). Box plots throughout same as in Fig. 2b. (c) Photobleaching curves for EBFP2, mTagBFP2, Electra1, Electra2 in live neurons under continuous wide-field illumination (n = 8, 26, 32, and 26 neurons, respectively; imaging conditions of BFPs: continuous illumination under 403 nm LED, 3.72 mW/mm2). |