
- Title
-
Dual-expression system for blue fluorescent protein optimization
- Authors
- Papadaki, S., Wang, X., Wang, Y., Zhang, H., Jia, S., Liu, S., Yang, M., Zhang, D., Jia, J.M., Köster, R.W., Namikawa, K., Piatkevich, K.D.
- Source
- Full text @ Sci. Rep.

Development and validation of new pHybrid expression vector. (a) pHybrid-BFP-mScarlet vector map. Introduction of a new hybrid vector for bacterial and mammalian expression of target gene using mScarlet as reference gene. (b) pHybrid linear map showing basic features of pHybrid vector: (top) origin of replication, BFPs under CMV promoter and rhaB promoter for expression in mammalian cells and E. coli, respectively, followed by rrnB T1 terminator and SV40 poly-A tail, mScarlet under SV40 promoter regulation followed by HSV TK poly-A tail; (bottom) nucleotide sequence of the SD sequence, His-tag and Kozak sequence elements in front of the BFP gene. (c) Fluorescence images of E. coli bacteria transformed with pHybrid-mBlueberry2/mScarlet (mBlueberry2), pHybrid-EBFP2/mScarlet (EBFP2), and pHybrid-mTagBFP2/mScarlet (mTagBFP2) expression vectors in blue (top) and red (bottom) channels (imaging conditions: 403 nm/456 nm excitation/emission for blue, ex/em 561 mn/594 nm for mScarlet). (d) Fluorescence images of HEK cells transfected with pHybrid-mBlueberry2/mScarlet (mBlueberry2), pHybrid-EBFP2/mScarlet (EBFP2), and pHybrid-mTagBFP2/mScarlet (mTagBFP2) expression vectors in blue (top), red channel (middle) and merged (bottom) (imaging conditions: 403 nm excitation, 456 nm emission for BFPs; 561 nm excitation, 594 nm emission for mScarlet, 0.91 mW/mm2 power). The dynamic range of all images was adjusted independently to facilitate visualization. (e) Correlation of HEK intracellular brightness and in vitro brightness for blue fluorescence variants selected from the random library of BFP derived from mRuby3 (see Supplementary Table S1 for statistics; Pearson’s correlation shown in graph; imaging conditions of HEK same as in (d)). |

Screening of blue mRuby3 variants, in vitro characterization of two best performing mutants. (a) Intracellular brightness and photostability half-times of 67 variants expressed in HEK cells using pHybrid-/mScarlet expression under screening conditions. Imaging conditions for intracellular brightness of BFP variants: 403 nm LED excitation, 456 nm emission; for half-life measurement: 403 nm LED excitation, 456 nm emission (Supplementary Table S2). (b) Blue-to-red fluorescence ratio in live HEK cells expressing 7 best performing blue mRuby3 variants using pHybrid-/mScarlet (n = 73, 71, 48, 89, 80, 72, 55 cells from one transfection; Kruskal–Wallis ANOVA p-value = 8.4e-8; Supplementary Table S3; imaging conditions for BFPs: 403 nm LED excitation, 456 nm emission, 0.91 mW/mm2 power). Narrow part of notch, median; top and bottom of the notch, 95% confidence interval for the median; top and bottom horizontal lines, 25% and 75% percentiles of the data; whiskers extend 1.5 × IQR from the 25th and 75th percentiles; horizontal line, mean; dots, outliers. Subplot shows intracellular brightness (y’y) and photostability half-times (x’x) resulted from (b, c). Electra1 is shown in light blue, Electra2 in dark blue throughout. (c) Time dependent intracellular fluorescence as part of the screening process in HEK cells using pHybrid-/mScarlet as expression vector (n = 10, 10, 10, 10, 11, 11, 11 cells from one transfection; imaging conditions for BFPs: 403 nm LED excitation, 456 nm emission; 4.25 mW/mm2 power). (d, e) In vitro excitation and emission spectra of Electra1 and Electra2, respectively. Excitation was measured in the range 250 nm-500 nm and emission from 420 to 700 nm for both purified proteins; Ex peak at 402 nm for Electra1; Ex peak at 403 nm for Electra2; Em peak at 456 nm for both proteins. |
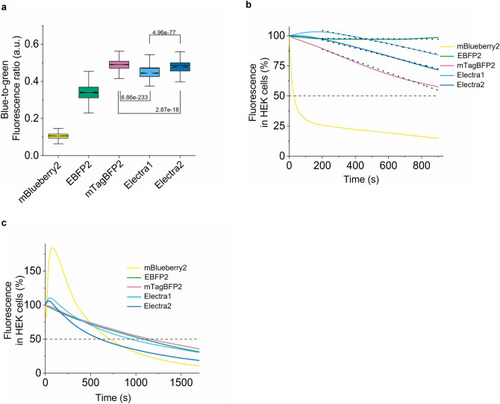
Characterization of Electra1, Electra2 in mammalian cell culture. (a) Blue-to-green fluorescence ratio in live HEK cells co-expressing mBlueberry2, EBFP2, mTagBFP2, Electra1, and Electra2 with EGFP via the P2A self-cleaving peptide (n = 835, 573, 1698, 1229, and 664 cells respectively, 4 independent transfections each; Kruskal–Wallis ANOVA, p-value = 0; post-hoc Kolmogorov-Smirnoff two sample p-values shown in graph; Supplementary Table S4). Imaging conditions for BFPs: 403 nm LED excitation, emission 456 nm, 0.91 mW/mm2 power. Box plots same as in Fig. 2b. (b) Normalized photobleaching curves for mBlueberry2, EBFP2, mTagBFP2, Electra1 and Electra2 expressed in HEK cells (n = 97, 81, 122, 105, 70 cells respectively, 4 independent transfections each; imaging conditions for BFPs: excitation 403 nm LED excitation, emission 456 nm, 0.91 mW/mm2 power). Dotted lines represent linear fit (decrease rate for EBFP2, mTagBFP2, Electra1, Electra2 in fluorescence %/sec: 8.33195e-4, 487.4e-4, 282e-4, 341.3e-4, respectively, fitting details in Supplementary Table S4). (c) Normalized photobleaching curves for mBlueberry2, EBFP2, mTagBFP2, Electra1 and Electra2 expressed in HEK cells (n = 63, 79, 137, 144, 90 respectively; 4 independent transfections each; imaging conditions for HEK cells: 403 nm LED excitation, 456 nm emission, 4.25 mW/mm2 power). |

Electra variants performance as fusion tags in live HeLa cells. (a) -terminal fusion of mTagBFP2, Electra1 and Electra2 with CytERM for OSER assay (one transfection each; see Supplementary Table S5). Representative images of healthy cells and cells with whorls are shown (403 nm excitation; 430–490 nm emission). The dynamic range of all images was adjusted independently to facilitate visualization. (b) From top left to right: COX8A-Electra1, paxillin-Electra1, β-actin-Electra1, keratin-Electra1, laminA-Electra1, α-tubulin-Electra1, H2B-Electra1, paxillin-Electra2, β-actin-Electra2, keratin-Electra2, laminA-Electra2, α-tubulin-Electra2, H2B-Electra2, α-tubulin-mTagBFP2 (imaging conditions: 403 nm excitation; 490 nm emission). The dynamic range of all images was adjusted independently to facilitate visualization. |
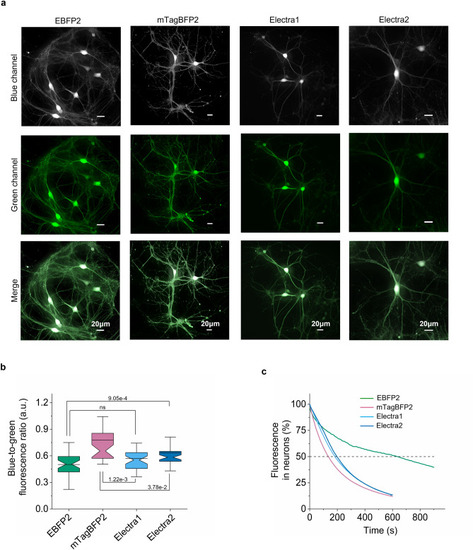
Characterization of Electra variants in cultured neurons. (a) Representative images of hippocampal neurons at DIV14 co-expressing EBFP2, mTagBFP2, Electra1, or Electra2 under human synapsin promoter with EGFP via P2A self-cleaving peptide. BFPs are shown in grey; EGFP in green (n = 35, 37, 38, 40 respectively, from 2 independent rAAV2/9 transductions each; imaging conditions for BFPs: 403 nm excitation; 456 nm emission; 0.91 mW/mm2; z-stack max projection; image deconvolution using NIS Elements online deconvolution tool). The dynamic range of all images was adjusted independently to facilitate visualization. (b) Quantification of blue-to-green fluorescence ratio in live hippocampal neurons (n = 35, 37, 38, 40 neurons for EBFP2, mTagBFP2, Electra1, Electra2, respectively, from 2 independent transductions each; Kruskal–WaNllis ANOVA p-value = 4.66e-8; post-hoc two sample Kolmogorov-Smirnoff p-values shown in graph; Supplementary Table S6). Box plots throughout same as in Fig. 2b. (c) Photobleaching curves for EBFP2, mTagBFP2, Electra1, Electra2 in live neurons under continuous wide-field illumination (n = 8, 26, 32, and 26 neurons, respectively; imaging conditions of BFPs: continuous illumination under 403 nm LED, 3.72 mW/mm2). |

Fluorescence comparison of mTagBFP2, Electra1 and Electra2 in small model organisms. (a) Whole body images of representative C. elegans worms co-expressing mTagBFP2, Electra1 and Electra2 with mNeonGreen under pan-neuronal promoter tag168 and mScarlet in most somatic cells. Higher magnification images of neuronal ring under blue (shown in grey), green (mNeonGreen), red channel (mScarlet) and merged. Imaging conditions: 405 nm excitation for BFPs, 430–470 nm emission; 488 nm excitation for mNeonGreen, 500–540 nm emission; 561 nm excitation for mScarlet, 570–620 nm emission. The dynamic range of all images was adjusted independently to facilitate visualization. (b) Blue-to-green fluorescence ratio comparison in C. elegans neuronal ring (n = 9 worms for each protein; Kruskal Wallis ANOVA p-value = 1.29e-4; post-hoc two sample Kolmogorov-Smirnoff p-values shown in graph; Supplementary Table S7). (c) Representative whole overview image of 4dpf zebrafish expressing each BFP throughout brain and spinal cord (left). Higher magnified images of blue, red, and merged fluorescence in hindbrain (middle) and spinal cord (right) neurons. Transient co-expression of each BFP and mScarlet was induced by injection into zebrafish embryos with a construct carrying each BFP-P2A-mScarlet whose expression is under the control of pan-neuronal nbt promoter. Imaging conditions: Blue channel: excitation 405 nm laser, emission 420–480 nm; red channel: excitation 561 nm laser, emission 565–606 nm). The dynamic range of all images was adjusted independently to facilitate visualization. (d) Blue-to-red fluorescence ratio comparison in zebrafish hindbrain expressing mTagBFP2, Electra1, Electra2 (n = 116, 117, 116 neurons from 4 independent zebrafish; Kruskal–Wallis ANOVA p-value = 1.98e-19; post-hoc two sample Kolmogorov-Smirnoff p-values shown in graph; Supplementary Table S8; imaging conditions for BFPs: same as in (a)). (e) Blue-to-red fluorescence ratio comparison in zebrafish spinal cord neurons expressing mTagBFP2, Electra1, Electra2 (n = 113, 118, 117 neurons from 4 independent zebrafish; Kruskal–Wallis ANOVA p-value = 1,2e-8; post-hoc two sample Kolmogorov-Smirnoff p-values shown in graph; Supplementary Table S8) with mScarlet. Imaging conditions for BFPs: same as in (c). (f)Time-dependent blue fluorescence measurement for mTagBFP2, Electra1, Electra2 (n = 40, 40, 40, respectively from 4 independent zebrafish) in spinal cord neurons. Imaging conditions of BFPs: Blue channel: excitation 405 nm laser, emission 420–464 nm. |

Comparison of EBFP2, mTagBFP2, Electra1, Electra2 in mouse cortex in vivo. (a) In vivo two-photon microscopy of cortex neurons co-expressing mTagBFP2, Electra1, or Electra2 with EGFP in live mice. Representative images of mTagBFP2, Electra1, Electra2 from cortex layer2/3 (~ 350 μm depth). The dynamic range was adjusted independently to facilitate visualization. (b) Blue-to-green fluorescence comparison in live mouse cortex neurons (L1 and L2/3) at P21 after injection expressing mTagBFP2, Electra1, Electra2 (n = 38, 43, 38 neurons, respectively, from one mouse each; Kruskal–Wallis ANOVA p-value = 9.63e-10, post-hoc Kolmogorov-Smirnoff p-values shown in graph; Supplementary Table S9). (c) Blue-to-green fluorescence ratio comparison in live mouse cortex presented independently for L1 and L2/3 (nL1 = 12, 16, 21 neurons for mTagBFP2, Electra1 and ELectra2, respectively; Kruskal–Wallis ANOVA p-valueL1 = 7.7e-8; post-hoc KS p-values shown in graph; nL2/3 = 26, 27, 17 neurons for mTagBFP2, ELectra1 and ELectra2, respectively; KW ANOVA p-valueL2/3 = 1.04e-9; post-hoc KS p-values shown in graph; Supplementary Table S9). |