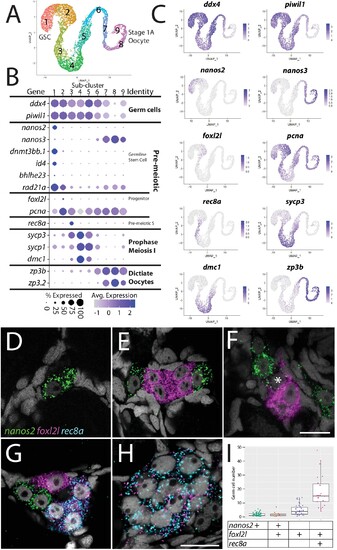
(A) Germ cell subcluster uniform manifold approximation and projection (UMAP) plot, with cells color-coded by computationally determined cell subtypes. (B) Dot plot showing the relative expression of select genes in the germ cell subclusters. Some genes, like ddx4 and piwil1, are expressed in all germ cells, while others, such as nanos2 or rec8a, are only expressed in distinct subclusters. (C) Gene expression UMAP plots of select genes. (D–H) Triple hybridization chain reaction RNA fluorescent in situ hybridization (HCR RNA-FISH) for nanos2 (green), foxl2l (magenta), and rec8a (blue) in 40-day-old zebrafish whole-mount ovary. Asterisk in (F) indicates a cell double-positive for nanos2 and foxl2l. (I) Cell number quantification of individual cysts that express the genes indicated on Y-axis. n = 70, N = 3. Scale bar in (F), for (D–G) 10 µm; in (H) 10 µm.