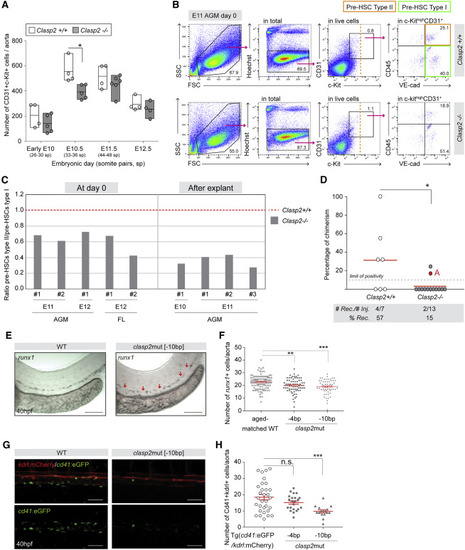
Figure 1. CLASP2 regulates HSPC production in the aortae of mouse and zebrafish embryos (A) Number of CD31+c-Kit+ IAHC cells per early E10, E10.5, E11.5, and E12.5 Clasp2+/+ and Clasp2−/− aortae (16 Clasp2+/+, 20 Clasp2−/− embryos, n = 4). One dot represents one embryo. (B) Representative flow cytometry analyses of type I (green gate, c-Kit+CD31+VE-cad+CD45−) and type II (orange gate, c-Kit+CD31+VE-cad+CD45+) pre-HSC populations at day 0 in E11 AGMs isolated from Clasp2+/+ (top panels) and Clasp2−/− (bottom panels) embryos (14 Clasp2+/+, 8 Clasp2−/−, n = 3). (C) Ratio between the percentages of type II and type I pre-HSCs at day 0 in E11 (n = 2) and E12 (n = 1) AGMs and E12 FLs (n = 2) (left panel) and after explant culture of E10 (n = 1) and E11 (n = 3) AGMs of Clasp2+/+ and Clasp2−/− embryos. #, independent experiments. The ratio for Clasp2+/+ was set at 1. Average fold decrease: 1.7 ± 0.4 at day 0 (E11/E12) and 2.9 ± 0.6 after explant (E10/E11). (D) Hematopoietic repopulation (percentage of chimerism) after injection of E11 Clasp2+/+ and Clasp2−/− AGM cells (n = 6, 1 ee/mouse). Dot, one mouse transplant; dashed line, limit of positivity (>10% of chimerism in blood); red line, chimerism average. (E) Representative images of WISH for runx1 expression in WT and clasp2mut[−10bp] zebrafish embryos (40 hpf). Red arrows, areas with no runx1+ cells. (F) Number of runx1+ cells in the aortae of WT, clasp2mut[−4bp], and clasp2mut[−10bp] embryos (40 hpf) (n = 5; 97 WT, 71 clasp2mut[−4bp], 57 clasp2mut[−10bp]). (G) Representative merge and single GFP fluorescence images of Tg(cd41:eGFP/kdrl:mCherry) (WT) and clasp2mut[−10bp] embryos (background Tg(cd41:eGFP/kdrl:mCherry)) at 40 hpf. (H) Number of Cd41+kdrl+ HSPCs per aorta in WT, clasp2mut[−4bp], and clasp2mut[−10bp] embryos at 40 hpf (n = 3; 31 WT, 25 clasp2mut[−4bp], 20 clasp2mut[−10bp]). Line, mean (A and D). Error bars, mean ± SEM (F and H). ∗∗∗p < 0.001, ∗∗p < 0.01, ∗p < 0.05; n.s., not significant; Mann-Whitney U test (A, D, F, and H). Scale bars: 100 μm (E and G). IAHC, intra-aortic hematopoietic cluster; sp, somite pair; WT, wild type; E, embryonic day; AGM, aorta-gonad-mesonephros; hpf, hour post fertilization; WISH, whole in situ hybridization; # Rec, number of reconstituted mice; # Inj, number of injected mice; % Rec, percentage of reconstituted recipients. See also Figures S1–S4.
|
