
- Title
-
CLASP2 safeguards hematopoietic stem cell properties during mouse and fish development
- Authors
- Klaus, A., Clapes, T., Yvernogeau, L., Basu, S., Weijts, B., Maas, J., Smal, I., Galjart, N., Robin, C.
- Source
- Full text @ Cell Rep.
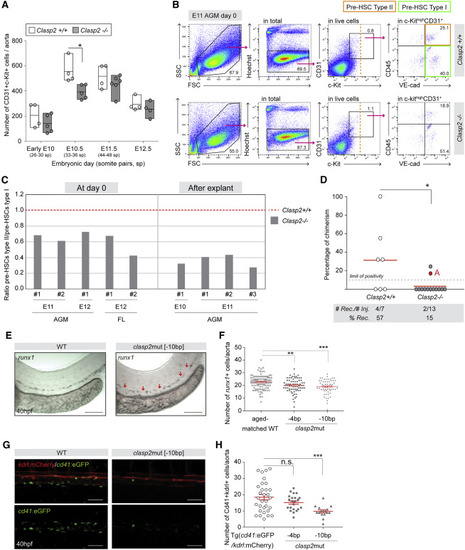
Figure 1. CLASP2 regulates HSPC production in the aortae of mouse and zebrafish embryos (A) Number of CD31+c-Kit+ IAHC cells per early E10, E10.5, E11.5, and E12.5 Clasp2+/+ and Clasp2−/− aortae (16 Clasp2+/+, 20 Clasp2−/− embryos, n = 4). One dot represents one embryo. (B) Representative flow cytometry analyses of type I (green gate, c-Kit+CD31+VE-cad+CD45−) and type II (orange gate, c-Kit+CD31+VE-cad+CD45+) pre-HSC populations at day 0 in E11 AGMs isolated from Clasp2+/+ (top panels) and Clasp2−/− (bottom panels) embryos (14 Clasp2+/+, 8 Clasp2−/−, n = 3). (C) Ratio between the percentages of type II and type I pre-HSCs at day 0 in E11 (n = 2) and E12 (n = 1) AGMs and E12 FLs (n = 2) (left panel) and after explant culture of E10 (n = 1) and E11 (n = 3) AGMs of Clasp2+/+ and Clasp2−/− embryos. #, independent experiments. The ratio for Clasp2+/+ was set at 1. Average fold decrease: 1.7 ± 0.4 at day 0 (E11/E12) and 2.9 ± 0.6 after explant (E10/E11). (D) Hematopoietic repopulation (percentage of chimerism) after injection of E11 Clasp2+/+ and Clasp2−/− AGM cells (n = 6, 1 ee/mouse). Dot, one mouse transplant; dashed line, limit of positivity (>10% of chimerism in blood); red line, chimerism average. (E) Representative images of WISH for runx1 expression in WT and clasp2mut[−10bp] zebrafish embryos (40 hpf). Red arrows, areas with no runx1+ cells. (F) Number of runx1+ cells in the aortae of WT, clasp2mut[−4bp], and clasp2mut[−10bp] embryos (40 hpf) (n = 5; 97 WT, 71 clasp2mut[−4bp], 57 clasp2mut[−10bp]). (G) Representative merge and single GFP fluorescence images of Tg(cd41:eGFP/kdrl:mCherry) (WT) and clasp2mut[−10bp] embryos (background Tg(cd41:eGFP/kdrl:mCherry)) at 40 hpf. (H) Number of Cd41+kdrl+ HSPCs per aorta in WT, clasp2mut[−4bp], and clasp2mut[−10bp] embryos at 40 hpf (n = 3; 31 WT, 25 clasp2mut[−4bp], 20 clasp2mut[−10bp]). Line, mean (A and D). Error bars, mean ± SEM (F and H). ∗∗∗p < 0.001, ∗∗p < 0.01, ∗p < 0.05; n.s., not significant; Mann-Whitney U test (A, D, F, and H). Scale bars: 100 μm (E and G). IAHC, intra-aortic hematopoietic cluster; sp, somite pair; WT, wild type; E, embryonic day; AGM, aorta-gonad-mesonephros; hpf, hour post fertilization; WISH, whole in situ hybridization; # Rec, number of reconstituted mice; # Inj, number of injected mice; % Rec, percentage of reconstituted recipients. See also Figures S1–S4. |
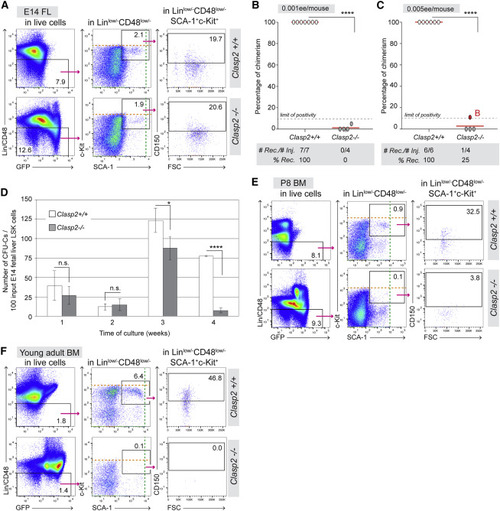
Figure 2. CLASP2 is required to maintain HSC activity throughout mouse development (A) Gating strategy to analyze phenotypically defined HSCs (Lin−/lowSCA-1+c-Kit+CD150+CD48−/low) in E14 FLs (n = 3; 8 Clasp2+/+, 7 Clasp2−/−). (B and C) Hematopoietic repopulation analyses after injection of 0.001 ee (B, n = 3) and 0.005 ee (C, n = 3) of E14 Clasp2+/+ and Clasp2−/− FL cells. Red dot, mouse B. (D) Average of CFU-Cs produced weekly per 100 Lin−SCA-1+c-Kit+ (LSK) input cells sorted from Clasp2+/+ and Clasp2−/− E14 FLs and cultured in the LTC-IC culture system for up to 4 weeks. Shown is 1 representative experiment of 2. Error bars, mean ± SD between triplicates. (E and F) Gating strategy to analyze phenotypically defined HSCs in the BM of Clasp2+/+ (top panels) and Clasp2−/− (bottom panels) P8 mice (n = 3) (E) and young adult mice (4.5 weeks old, n = 3) (F). Orange and green dashed lines, highest level of c-Kit and SCA-1 fluorescence, respectively (A, E, and F). Clasp2−/− cells express GFP (as seen in the bottom left plots of A, E, and F; see also STAR Methods). Error bars: mean ± SD (D). ∗∗∗∗p < 0.0001, ∗p < 0.05, Mann-Whitney U test (B and C), Student’s t test (D). FL, fetal liver; BM, bone marrow. See also Figures S1 and S3. |
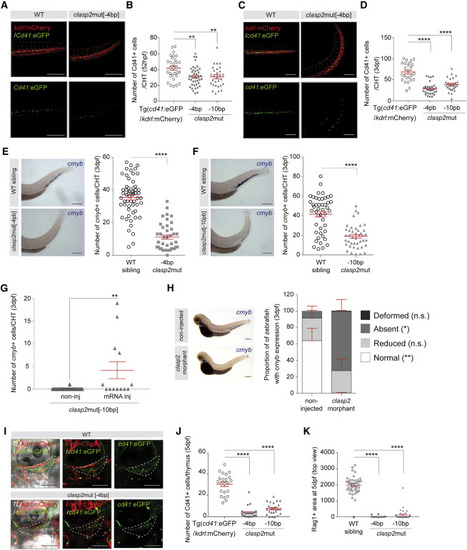
Figure 3. CLASP2 is required to maintain HSPC activity throughout zebrafish development (A) Representative merge (top panels) and single GFP fluorescence (bottom panels) images of Tg(cd41:eGFP/kdrl:mCherry) (WT) and clasp2mut[−4bp] zebrafish CHTs (background Tg(cd41:eGFP/kdrl:mCherry)) at 52 hpf (n = 3). (B) Number of Cd41+ cells in the CHT of WT, clasp2mut[−4bp] and clasp2mut[−10bp] zebrafish embryos at 52 hpf (n = 4–5; 30 WT, 41 clasp2mut[−4bp], 29 clasp2mut[−10bp] embryos). (C) Representative merge (top panels) and single GFP fluorescence (bottom panels) images of Tg(cd41:eGFP/kdrl:mCherry) and clasp2mut[−4bp] zebrafish CHTs at 3 dpf (n = 3). (D) Number of Cd41+ cells in the CHT of WT, clasp2mut[−4bp], and clasp2mut[−10bp] zebrafish embryos at 3 dpf (n = 4; 25 WT, 32 clasp2mut[−4bp], 27 clasp2mut[−10bp]). (E and F) Representative WISHs and graphs showing the number of cmyb+ cells in the CHT of WT sibling, clasp2mut[−4bp] (E) and clasp2mut[−10bp] (F) embryos at 3 dpf (n = 4, with a total of 57 WT [sibling], 40 clasp2mut[−4bp], 46 WT [sibling], and 42 clasp2mut[−10bp] embryos). Representative images of WISH for cmyb expression are shown on the left. (G) Number of cmyb+ cells per CHT of clasp2mut[−10bp] embryos non-injected (non-inj) or injected (inj) with WT clasp2 mRNA for rescue and analyzed at 3dpf. (H) Proportion of zebrafish embryos with normal or reduced presence or absence of cmyb expression in the CHT or deformity at 3 dpf after no injection or injection of clasp2 morpholinos. Representative cases of WISH for cmyb expression are shown on the left. n = 5 with a total of 155 non-inj and 239 inj embryos. (I) Representative merge (left panels), double (center panels), and single GFP (right panels) fluorescence images of Tg(cd41:eGFP/kdrl:mCherry) (WT) and clasp2mut[−4bp] (background Tg(cd41:eGFP/kdrl:mCherry)) zebrafish thymi (dashed area) at 5 dpf. (J) Number of Cd41+ cells in the thymus (dashed areas shown in I) of WT, clasp2mut[−4bp] and clasp2mut[−10bp] embryos at 5 dpf (n = 3; 22 WT, 25 clasp2mut[−4bp], 23 clasp2mut[−10bp]). (K) Rag1+ area (arbitrary unit) from the top view of the thymus (sum of both thymi) at 5 dpf in WT sibling, clasp2mut[−4bp], and clasp2mut[−10bp] embryos (n = 2; 42 WT, 20 clasp2mut[−4bp], 39 clasp2mut[−10bp]). Green, GFP; ted, mCherry (A, C, and I). Mean ± SEM (B, D–H, J, and K). ∗∗∗∗p < 0.0001, ∗∗p < 0.01, ∗p < 0.05, Mann-Whitney U test (B, D–H, J, and K). Scale bars, 200 μm (A and C) and 100 μm (I). CHT, caudal hematopoietic tissue. dpf, day post fertilization. See also Figures S4 and S5. |

Figure 4. Premature hematopoietic differentiation in Clasp2−/− embryos compared with Clasp2+/+ embryos (A) Number of CFU-Cs per 100,000 AGM cells of E11 Clasp2+/+ and Clasp2−/− embryos. (B) Number of total cells per E11 AGM of Clasp2+/+ and Clasp2−/− embryos at day 0. (C) Number of CFU-Cs per 100,000 E11 AGM cells obtained after 3 days of explant culture. (D) Number of total cells per E11 AGM after explant culture. (E) Number of CFU-Cs per 105 E14 FL cells. (F) Number of total cells per E14 FLs. (G) Number of CFU-Cs per 1 ee of E11 YS cells. (H) Fold change of clasp2 (alpha) mRNA in total cells and sorted CD31+ endothelial cells from E11 WT YSs compared with sorted CD31+ endothelial cells from E11 WT AGMs (value set at 1) after qRT-PCR. (I) Number of CFU-Cs per 50,000 BM cells obtained from P8 neonates. For E11 AGM at day 0, n = 3 [10 Clasp2+/+, 12 Clasp2−/−]; E11 AGM explant, n = 5 [12 Clasp2+/+, 16 Clasp2−/−]; E14 FL, n = 3 [3 Clasp2+/+, 4 Clasp2−/−]; E11 YS, n = 3 [10 Clasp2+/+ and 12 Clasp2−/−]; P8 BM neonates, n = 2 [2 Clasp2+/+, 2 Clasp2−/−]. Data are represented as mean ± SEM (B, D, and F) and mean ± SE (H). ∗∗∗p < 0.001, ∗∗p < 0.01, ∗p < 0.05, Mann-Whitney U test. CFU-GEMM, colony-forming unit-granulocyte-erythroid-macrophage-megakaryocyte; CFU-GM, CFU-granulocyte-macrophage; CFU-M, CFU-macrophage; CFU-G, CFU-granulocyte; BFU-E, burst-forming unit-erythroid; YS, yolk sac. See also Figure S6. |

Figure 5. Progressive loss of c-Kit at the plasma membrane of Clasp2−/− cells throughout development (A) MFI of c-Kit measured by flow cytometry in E11 Clasp2+/+ and Clasp2−/− AGMs (9 Clasp2+/+, 7 Clasp2−/−, n = 7). (B) Tile-scale image reconstruction of a whole E10.5 Clasp2+/+ embryo stained with c-Kit (green) and CD31 (red) antibodies. (C) Enlarged image of position 5 shown in (B), with a dashed box outlining the inset, which is shown enlarged on the right and reveals c-Kit fluorescence (green) in an IAHC. Bottom panels: images of this IAHC in various focal planes to draw regions of interest (ROIs) at the maximal fluorescence intensity along the circumference of IAHC cells through a z stack series. (D) Illustration of a IAHC cell with the ROI (2 pixels in width) to measure the average c-Kit fluorescence intensity. (E) Average MFI of c-Kit along the plasma membrane circumference of IAHC cells in the aortae of E10, E10.5, and E12 Clasp2+/+ and Clasp2−/− embryos after whole-mount immunostaining with c-Kit antibody (E10: 1 Clasp2+/+, 2 Clasp2−/−; E10.5: 1 Clasp2+/+, 1 Clasp2−/−; E12: 1 Clasp2+/+, 1 Clasp2−/−). (F) MFI of c-Kit, SCA-1, and Lin markers, measured by flow cytometry in E14 FL and neonate and adult BM cells isolated from Clasp2+/+ and Clasp2−/− embryos and mice (E14 FLs [8 Clasp2+/+, 6 Clasp2−/− embryos], n = 3; P8 BM [6 Clasp2+/+, 8 Clasp2−/−], n = 6; adult BM [10 Clasp2+/+, 6 Clasp2−/−], n = 7). (G) WBs for c-Kit and tubulin (loading control) on lysates of E14 Clasp2+/+ and Clasp2−/− Lin− FL cells (2 Clasp2+/+, 5 Clasp2−/−, n = 2). c-Kit intensity is indicated in blue below the gel images; the Clasp2+/+ culture band was set at 100. (H) qRT-PCR for c-Kit on Lin− FL cells and total AGM cells from Clasp2+/+ and Clasp2−/− embryos isolated at E14 and E11, respectively. Error bars: mean ± SEM (A, E, and F), mean ± SD (H). ∗∗∗∗p < 0.0001, ∗∗∗p < 0.001, ∗p < 0.05, Mann-Whitney U test (A, E, and F), unpaired t test (H). Scale bars, 100 μm (B and C) and 10 μm (C, close up). |
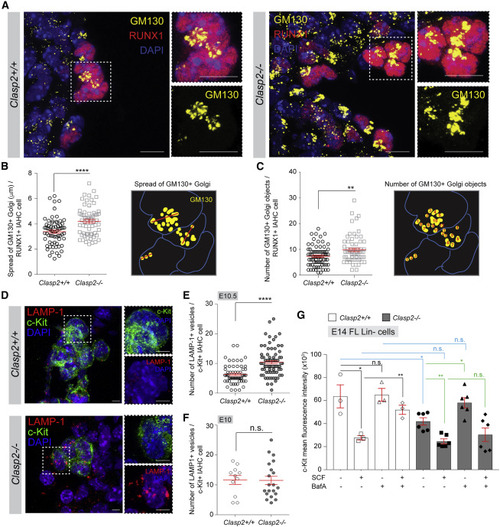
Figure 6. Increased c-Kit degradation and defective trafficking to the plasma membrane in Clasp2−/− IAHC cells and Lin− FL cells (A) Representative images of IAHCs in E10.5 Clasp2+/+ and Clasp2−/− embryos after staining with anti-GM130 (yellow), anti-RUNX1 (red), and DAPI (blue). Dashed boxes are shown enlarged on the right in each main panel, with merge or single (GM130, yellow) fluorescence. (B and C) Spread (B) and number (C) of GM130+ Golgi per RUNX1+ IAHC cells in E10.5 Clasp2+/+ and Clasp2−/−embryos (n = 3). A schematic on the right side of each graph explains how the spread of Golgi (red lines) or the number of Golgi objects were measured. (D) Representative images of IAHCs in E10.5 Clasp2+/+ and Clasp2−/− embryos after staining with anti-c-Kit (green), anti-LAMP-1 (red), and DAPI (blue). Dashed boxes are shown enlarged on the right of each main panel, with merges of DAPI (blue) and c-Kit (green) or LAMP-1 (red)) fluorescence. (E and F) Number of LAMP-1+ vesicles per c-Kit+ IAHC cells in E10.5 (E) and E10 (F) Clasp2+/+ and Clasp2−/−embryos (n = 2–3). (G) MFI of c-Kit measured by flow cytometry in E14 Clasp2+/+ and Clasp2−/− Lin− FL cells cultured overnight alone or with stem cell factor (SCF; c-Kit ligand), Bafilomycin A1 (BafA), or SCF and BafA (all in triplicates). Data are represented as mean ± SEM (B, C, and E–G). ∗∗∗∗p < 0.0001, ∗∗p < 0.01, ∗p < 0.05, Mann-Whitney U test (B, C, E, and F), unpaired t test (G). Scale bars, 10 μm (A) and 5 μm (D). See also Figure S7. |
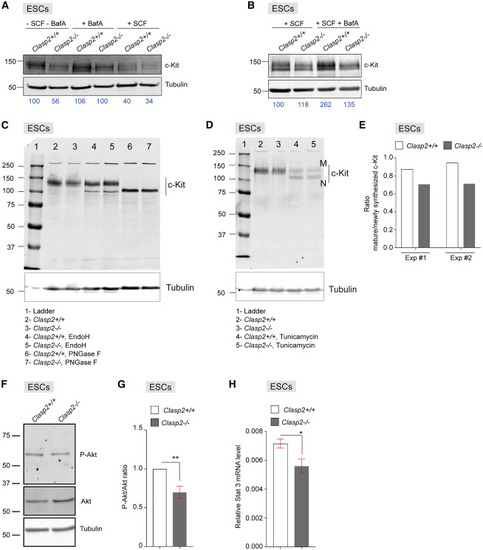
Figure 7. Disturbed c-Kit degradation and trafficking affect downstream targets in Clasp2−/− mouse ESCs (A) WBs for c-Kit and tubulin (loading control) on lysates of Clasp2+/+ and Clasp2−/− mouse embryonic stem cells (mESCs) cultured overnight alone or with BafA or SCF. (B) WBs for c-Kit and tubulin (loading control) on lysates of Clasp2+/+ and Clasp2−/− mESCs cultured overnight with SCF or SCF followed by BafA. (A and B) The c-Kit band intensities were quantified using tubulin as a control; these normalized intensities are indicated in blue below gel images, with the left lanes (Clasp2+/+ culture [A] or Clasp2+/+ culture with SCF [B]) set at 100 and the other intensities calculated relative to these values. (C) Mouse Clasp2+/+ and Clasp2−/− ESC lysates were treated with EndoH or PNGase F and examined by WB using antibodies against the indicated proteins (tubulin, loading control). Shown is 1 representative blot of 2. (D) Clasp2+/+ and Clasp2−/− mESCs were treated overnight with tunicamycin, and lysates were examined by WB using antibodies against the indicated proteins (tubulin, loading control). M, mature c-Kit; N, newly synthesized c-Kit. Shown is 1 representative blot of 2. (E) Ratio of mature c-KIT levels versus newly synthesized c-KIT, measured by quantifying M and N c-Kit band intensities on WB in Clasp2+/+ and Clasp2−/− mESC lysates in 2 independent experiments (Exp #1 [shown in D] and #2). (F) WB containing Clasp2+/+ and Clasp2−/− mESC lysate were probed with antibodies against total Akt and phospho-Akt (P-Akt) and against tubulin, which served as a loading control. Shown is 1 representative blot of 4, with two independent sets of biological replicates. (G) Graph representing the relative levels of phospho-Akt to total Akt after normalization to the tubulin loading control. (H) Graph representing the relative mRNA levels of STAT3 in Clasp2+/+ and Clasp2 −/− mESCs. qRT-PCR was performed using STAT3 primers and Gapdh, used as a housekeeping control. n = 3 with 3 biological replicates per condition. ∗∗p < 0.01, ∗p < 0.05, Mann-Whitney U test, mean ± SEM (G and H). |

ZFIN is incorporating published figure images and captions as part of an ongoing project. Figures from some publications have not yet been curated, or are not available for display because of copyright restrictions. EXPRESSION / LABELING:
PHENOTYPE:
|