
Fig. 11
- ID
- ZDB-FIG-220526-31
- Publication
- Alhashem et al., 2022 - Notch controls the cell cycle to define leader versus follower identities during collective cell migration
- Other Figures
- All Figure Page
- Back to All Figure Page
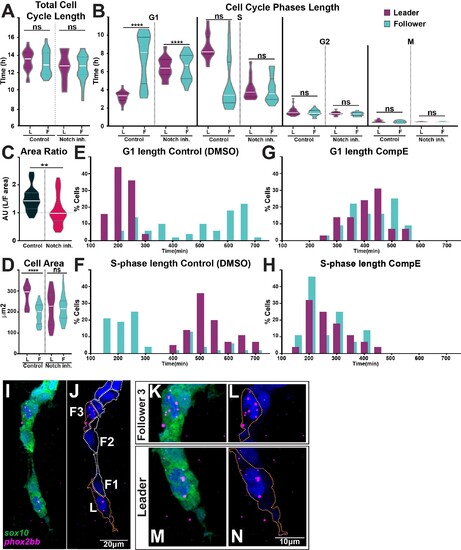
(A) Quantification of the cell cycle total duration under control (DMSO, numbers as in Figure 10B) and Notch inhibition conditions (CompE, leaders n = 17, followers n = 22, eight embryos; one-way ANOVA, p=0.1939). (B) Quantification of the cell cycle phases duration under DMSO (numbers as in Figure 10C) and Notch inhibition conditions CompE, leaders G1 n = 29, S n = 28, G2 n = 25, and M n = 25, seven embryos; followers G1 n = 32, S n = 32, G2 n = 30, and M n = 30, seven embryos; Brown–Forsythe and Welch’s ANOVA tests, all phases G1, S, G2, and M p>0.9999 between leaders and followers. (C) Quantification of cell area ratio (leaders/followers) under DMSO and Notch-inhibited conditions (n as in D; Brown–Forsythe and Welch’s ANOVA tests, DMSO control vs. CompE p= 0.0157). (D) Quantification of cell area under DMSO (leaders n = 26, followers n = 22, six embryos) and CompE conditions (leaders n = 44, followers n = 41, seven embryos). Brown–Forsythe and Welch’s ANOVA tests, DMSO leaders vs. followers p<0.0001, CompE leaders vs. followers p>0.9999. (E, F) Frequency distribution of G1- and S-phases durations in control conditions (DMSO; leaders: G1 n = 45, S n = 44, 11 embryos; followers: G1 n = 50, S n = 48, 11 embryos). (G, H) Frequency distribution of G1- and S-phases durations in Notch inhibition conditions (CompE; leaders: G1 n = 29, S n = 28, seven embryos; followers: G1 n = 32, S n = 32, seven embryos). (I–N) Images of phox2bb expression in 24 hpf Sox10:GFP embryo. (K–N) Enlargements of follower 3 and leader cells in (I, J). Orange dotted lines mark leader and third follower cell outline; white dotted lines mark followers' outline.
|