
Fig. 5
- ID
- ZDB-FIG-220526-23
- Publication
- Alhashem et al., 2022 - Notch controls the cell cycle to define leader versus follower identities during collective cell migration
- Other Figures
- All Figure Page
- Back to All Figure Page
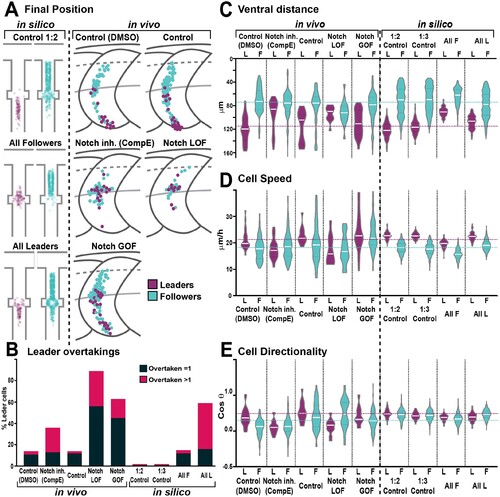
(A) Final position of each cell in model simulations and in vivo experiments under different conditions. In silico results depicted in confined pathway, in vivo data graphed in model embryo, somites contour and dorsal midline (dark grey lines), edge of the premigratory area (dashed lines), and NT/not boundary (light grey lines). Anterior left, dorsal up. (B) Quantification of leader overtaking events in vivo and in silico. Leader overtaken by a single follower is overtaken = 1; leader overtaken by more than one follower cell is overtaken >1. (C) Quantification of the ventral advance of cells in vivo and in silico. (D) Quantification of cell speed in vivo and in silico. (E) Quantification of cell directionality in vivo and in silico. Leader cells in magenta, followers in cyan. Magenta and cyan dashed lines indicate the average values for leaders and followers respectively. Full statistical analysis in Supplementary file 1.
|