
Fig. 4
- ID
- ZDB-FIG-220520-50
- Publication
- Brunsdon et al., 2022 - Aldh2 is a lineage-specific metabolic gatekeeper in melanocyte stem cells
- Other Figures
- All Figure Page
- Back to All Figure Page
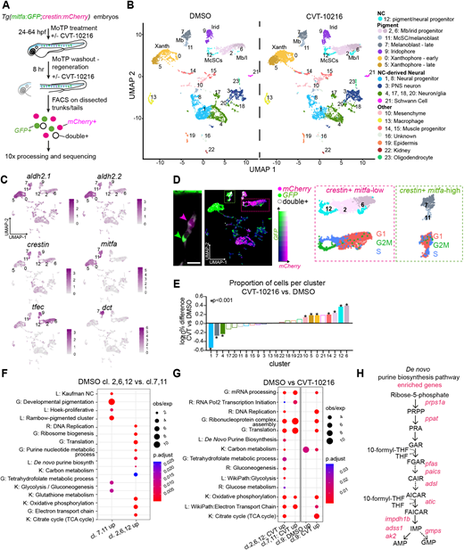
scRNA-seq reveals an Aldh2 metabolic gatekeeper function. (A) Experimental design for the scRNA-seq experiment to capture the McSCs in regeneration. (B) UMAPs of Tg(crestin:mCherry, mitfa:GFP)-positive cells after clustering, split by drug treatment. Mb, melanoblasts; Xanth, xanthophores; Irid, iridophores. (C) UMAPs of both DMSO- and CVT-10216-treated cells with colour change from grey (negative) to purple based on log2 expression of aldh2.1 and aldh2.2 in pigment lineages compared with crestin (neural crest), tfec (melanophore/iridophore progenitors), mitfa (early melanoblasts) and dct (late melanoblasts). (D) Proposed relationship of imaged McSCs to scRNA-seq clusters, using an example niche from ig. 2D (scale bar is 20 µm) and UMAP coloured by expression intensity of mCherry (magenta) and GFP (green), and cells in which both are expressed (white). We predict that crestin+ mitfa-high cells (green arrow/box) are represented in clusters 7 and 11, and crestin+ mitfa-low cells (magenta arrow/box) are represented in clusters 2, 6 and 12. UMAPs of these clusters (top) and their predicted cell cycle phase (bottom) are shown. (E) The proportion of total cells within each cluster compared between treatment conditions. The log10 percentage difference of numbers of cells in the CVT-10216-treated clusters compared with DMSO equivalents was plotted, with asterisks indicating a significant difference in proportions (Chi squared test). (F) Dot-plot of pathway analysis showing selection of significantly upregulated GO (G), KEGG (K), reactome (R) and literature-based (L) terms in clusters 2, 6 and 12 compared with 7 and 11, and vice versa. Dot size represents observed/expected ratio and colour indicates adjusted P-value (Benjamini–Hochberg test). (G) As in F, but showing significant enrichment of pathways in CVT-10216-treated cells relative to DMSO from clusters 2, 6 and 12 (crestin+ mitfa-low), clusters 7 and 11 (crestin+ mitfa-high), and cluster 9 (predicted iridophores). (H) Schematic diagram of de novo purine biosynthesis, with genes encoding enzymes significantly upregulated in the CVT-10216 dataset from G shown in red. |