
- Title
-
Aldh2 is a lineage-specific metabolic gatekeeper in melanocyte stem cells
- Authors
- Brunsdon, H., Brombin, A., Peterson, S., Postlethwait, J.H., Patton, E.E.
- Source
- Full text @ Development
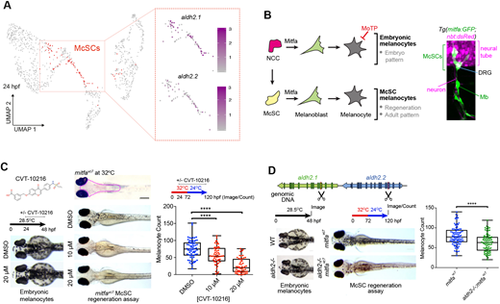
Lineage-specific requirement for Aldh2 in melanocyte regeneration. (A) UMAP of scRNA-seq data derived from 24 hpf embryos (Brombin et al., 2022) with McSCs in red. Feature plots of these isolated McSCs showing log2 expression of aldh2 paralogs with colour change from grey (negative) to purple. (B) Schematic of the melanocyte lineages in zebrafish development with confocal z-stacks depicting McSCs expressing mitfa:GFP located at the dorsal root ganglia (DRG) and melanoblasts (Mb) on the motor neurons. Neural tube and DRG are marked by nbt:dsRed expression. (C) Representative images of wild-type embryos treated with or without CVT-10216 during development (embryonic melanocytes) or in an McSC regeneration assay. Regenerated melanocytes were quantified within a consistent region delineated by the magenta dotted line on the non-regenerating control embryo (top). One data point plotted per embryo; boxes indicate median and quartiles; whiskers span minimum to maximum values. Scale bar: 500 µm. ****P<0.0001 (one-way ANOVA with Tukey's multiple comparisons test). Four experimental replicates. (D) Schematic of CRISPR-Cas9 strategy to target aldh2.1 and aldh2.2 with excision site between Cas9 cut sites (scissor symbols; see Fig. S1). Wild-type or aldh2−/− embryos in normal development or a McSC regeneration assay is shown. ****P<0.0001. An unpaired two-tailed t-test was performed to calculate statistical significance. One data point is plotted per embryo; boxes indicate median and quartiles; whiskers span minimum to maximum values; three experimental replicates. |
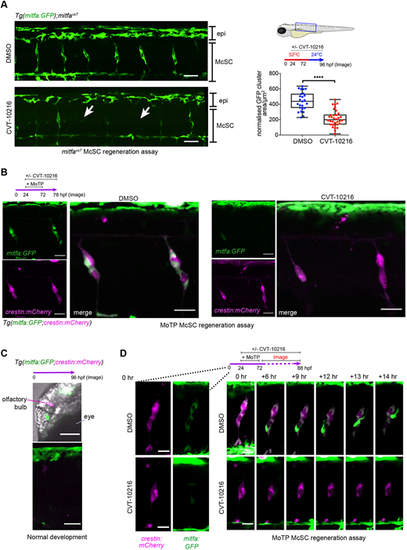
Live imaging captures the McSC requirement for Aldh2 to generate progeny. (A) An ALDH2 inhibitor (CVT-10216) causes loss of mitfa:GFP expression in McSCs, while dorsal stripe epithelial (epi) GFP+ melanoblasts remain. Representative confocal stack images of McSCs at the niche after 24 h regeneration with or without CVT-10216 treatment. The average mitfa:GFP niche area μm2/somite was quantified per embryo (one data point) Boxes indicate median and quartiles; whiskers span minimum to maximum values. McSCs with very low to no GFP signal are indicated with arrows. Scale bars: 50 μm, three experimental replicates.****P<0.0001 (unpaired, two-tailed t-test). (B) McSCs maintain neural crest identity when treated with an ALDH2 inhibitor (CVT-10216). Confocal stack images of McSC niches in CVT-10216-treated Tg(mitfa:GFP;crestin:mCherry) embryos after 6 h washout of MoTP. Two experimental replicates, five or more embryos used per condition, representative images shown. Scale bars: 50 µm. (C) 96 hpf non-regenerating Tg(mitfa:GFP;crestin:mCherry) embryos (same age as B) still express crestin:mCherry in the olfactory bulb and mitfa:GFP in embryonic epithelial melanoblasts [labelled in head (top) and trunk (bottom)], but no longer express these transgenes in McSC niches. Representative images of three embryos are shown. Scale bars: 50 µm. (D) Time-lapse stills of individual regenerating McSCs at the niches. Tg(mitfa:GFP; crestin:mCherry) embryos with or without CVT-1016 were imaged from 2 h post-MoTP washout. In a control embryo, an McSC undergoes cell division and a new mitfa:GFP-high cell migrates upwards towards the epidermis (see Movie 3). In a CVT-10216-treated embryo, mitfa:GFP expression is absent and migration is not observed (see Movie 4). Scale bars: 20 µm. |

McSCs require Aldh2, but not Adh5, for formaldehyde metabolism. (A) Melanocyte regeneration is sensitive to formaldehyde and this effect is stronger in aldh2−/− mutants. Images and quantification of melanocytes in zebrafish embryos in a mitfavc7 regeneration assay. Melanocyte counts were normalised to the mean of the respective control, each dot represents a single embryo; boxes indicate median and quartiles; whiskers span minimum to maximum values; three experimental replicates. **P<0.0021, ****P<0.0001 (one-way ANOVA with Tukey's multiple comparisons). (B) Schematic diagram of formaldehyde metabolism by Adh5 (cytosol) and Aldh2 (mitochondria). (C) Schematic diagram showing the adh5−/− CRISPR-Cas9 mutant, with sgRNA target site in exon 3 and alignment to wild-type sequence showing a deletion of 25 bp. (D) Sensitivity of adh5−/− embryos to increasing concentrations of formaldehyde from 24 hpf for 24 h, and surviving embryos quantified. Five experimental replicates, 20 embryos per condition. ***P<0.0002, ****P<0.0001 (two way ANOVA with Sidak's multiple comparisons). Data are mean±s.e.m. (E) MoTP regeneration assay on aldh2−/−, adh5−/− mutant embryos and embryos from an incross of adh5+/−; aldh2−/− fish (embryos genotyped after counting). One data point plotted per embryo; boxes indicate median and quartiles; whiskers span minimum to maximum values; three experimental replicates. ***P<0.0002, ****P<0.0001; ns, not significant (one-way ANOVA with Tukey's multiple comparisons). (F) MoTP regeneration assay on wild type and adh5−/− mutants treated with or without CVT-10216. One data point plotted per embryo; boxes indicate median and quartiles; whiskers span minimum to maximum values; three experimental replicates. ***P<0.0002, **P<0.0021; ns, not significant (one-way ANOVA with Tukey's multiple comparisons). |
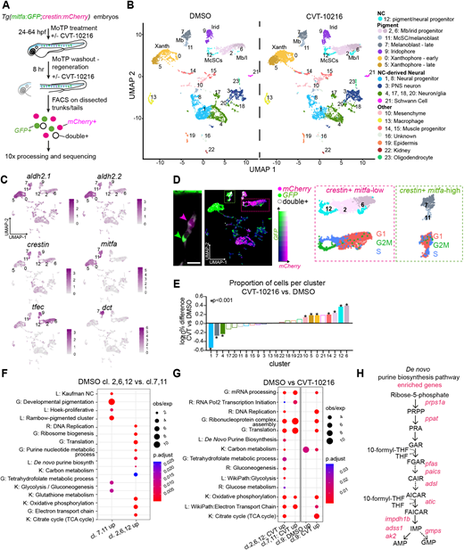
scRNA-seq reveals an Aldh2 metabolic gatekeeper function. (A) Experimental design for the scRNA-seq experiment to capture the McSCs in regeneration. (B) UMAPs of Tg(crestin:mCherry, mitfa:GFP)-positive cells after clustering, split by drug treatment. Mb, melanoblasts; Xanth, xanthophores; Irid, iridophores. (C) UMAPs of both DMSO- and CVT-10216-treated cells with colour change from grey (negative) to purple based on log2 expression of aldh2.1 and aldh2.2 in pigment lineages compared with crestin (neural crest), tfec (melanophore/iridophore progenitors), mitfa (early melanoblasts) and dct (late melanoblasts). (D) Proposed relationship of imaged McSCs to scRNA-seq clusters, using an example niche from ig. 2D (scale bar is 20 µm) and UMAP coloured by expression intensity of mCherry (magenta) and GFP (green), and cells in which both are expressed (white). We predict that crestin+ mitfa-high cells (green arrow/box) are represented in clusters 7 and 11, and crestin+ mitfa-low cells (magenta arrow/box) are represented in clusters 2, 6 and 12. UMAPs of these clusters (top) and their predicted cell cycle phase (bottom) are shown. (E) The proportion of total cells within each cluster compared between treatment conditions. The log10 percentage difference of numbers of cells in the CVT-10216-treated clusters compared with DMSO equivalents was plotted, with asterisks indicating a significant difference in proportions (Chi squared test). (F) Dot-plot of pathway analysis showing selection of significantly upregulated GO (G), KEGG (K), reactome (R) and literature-based (L) terms in clusters 2, 6 and 12 compared with 7 and 11, and vice versa. Dot size represents observed/expected ratio and colour indicates adjusted P-value (Benjamini–Hochberg test). (G) As in F, but showing significant enrichment of pathways in CVT-10216-treated cells relative to DMSO from clusters 2, 6 and 12 (crestin+ mitfa-low), clusters 7 and 11 (crestin+ mitfa-high), and cluster 9 (predicted iridophores). (H) Schematic diagram of de novo purine biosynthesis, with genes encoding enzymes significantly upregulated in the CVT-10216 dataset from G shown in red. |

The Aldh2 metabolic reaction product, formate, promotes McSC-derived progeny. (A) Representative images of a regeneration assay where control or CVT-10216-treated embryos were supplemented with 25 mM sodium formate. ****P<0.0001; ns, not significant. Kruskal–Wallis test with Dunn's multiple comparisons. One data point per embryo; boxes indicate median and quartiles; whiskers span minimum to maximum values; three experimental replicates. (B) A MoTP assay on Tg(mitfa:GFP;crestin:mCherry) embryos treated with or without CVT-10216, and with or without 25 mM sodium formate from 24 hpf. MoTP was washed out at 72 hpf, and embryos imaged confocally at 74 hpf. Two experimental replicates, more than five embryos imaged per replicate. Scale bars: 25 µm. Single channel images of crestin:mCherry expression (magenta) and mitfa:GFP expression (green) are shown alongside merged channels. (C) Schematic of 1C metabolism and proposed function for Aldh2 formate supply through formaldehyde metabolism (based on Burgos-Barragan et al., 2017). Tetrahydrofolate (THF) combines with formate to make 10-formyl-THF, which provides two carbons to make purine nucleosides. (D) Mtx treatment has no effect on embryonic melanocytes. Zebrafish embryos (wild type and aldh2−/−) treated with or without Mtx at 24 hpf for 48 h. n=3. (E) Representative images of control and aldh2−/− mutants with or without Mtx treatment in a mitfavc7 regeneration assay. The melanocyte count at each dose was normalised to its respective DMSO control. ***P<0.0002, ****P<0.0001 (one-way ANOVA performed with Tukey's multiple comparisons test). One data point plotted per embryo; boxes indicate median and quartiles; whiskers span minimum to maximum values; three experimental replicates. (F) Confocal z-stacks of mitfa:GFP McSCs in a mitfavc7 regeneration assay, in control or aldh2−/− embryos treated with or without Mtx. Scale bars: 50 µm. Two experimental replicates; boxes indicate median and quartiles; whiskers span minimum to maximum values; more than five embryos imaged per repeat. Quantification of GFP+ niche area/somite of embryos treated with Mtx is shown. ***P<0.0002, ****P<0.0001 (one-way ANOVA with Tukey's multiple comparisons). |
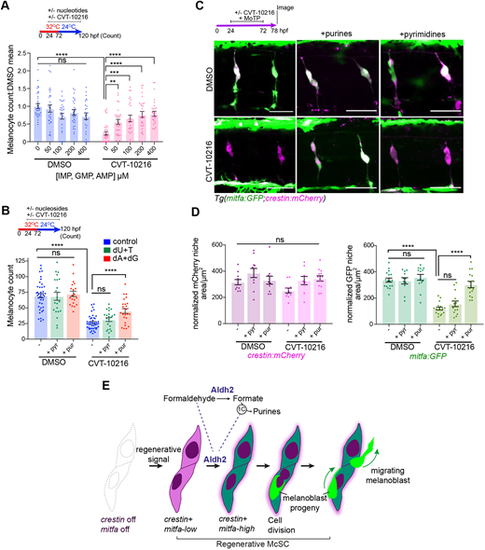
Aldh2 meets the demand of McSCs for purines. (A) Purine nucleotides rescue Aldh2-deficient melanocyte regeneration. Melanocyte regeneration assay in mitfavc7 embryos with or without CVT-10216 plus purine nucleotide cocktail. Melanocyte counts normalized to respective untreated controls. Each dot represents a single embryo, three experimental replicates. Data are mean±s.e.m. **P<0.0021, ***P<0.0002, ****P<0.0001; ns, not significant (one-way ANOVA with Tukey's multiple comparisons). (B) Purine, but not pyrimidine nucleosides, rescues Aldh2-deficient melanocyte regeneration. Melanocyte regeneration assay on mitfavc7 embryos with or without CVT-10216 and supplemented with deoxyadenosine (dA), deoxguanosine (dG) or deoxyuridine (dU) or thymidine (T) nucleosides (200 µM). Each datapoint represents a single embryo, three experimental replicates. ****P<0.0001; ns, not significant (one-way ANOVA with Tukey's multiple comparisons). Data are mean±s.e.m. (C) Purine nucleotides rescue McSC differentiation in ALDH2i-treated embryos. Representative confocal z-stacks of Tg(mitfa:GFP;crestin:mCherry) embryos treated with MoTP with or without CVT-12016, as well as 400 µM AMP/GMP purine nucleotides, or 400 µM UMP/thymidine pyrimidine nucleotides. Two experimental replicates, more than five embryos per condition. (D) Quantification of crestin:mCherry and mitfa:GFP niche areas from C. Each dot represents the sum of the GFP or mCherry niche area/ number of somites in view in one embryo. ****P<0.0001; ns, not significant (one-way ANOVA with Tukey's multiple comparisons). Data are mean±s.e.m. (E) Proposed model for Aldh2-mediated control of the McSC lineage. Regenerating McSCs start expressing crestin and low levels of mitfa. Next, McSCs increase their metabolic demands for purine nucleotides to express high levels of mitfa and generate progeny. This metabolic demand is met by Aldh2 metabolizing endogenous formaldehyde into formate, which is then used in the 1C cycle to fuel production of purine nucleotides. McSCs undergo cell division to generate progeny, which migrate away from the niche to the epidermis. ALDH2i (CVT-10216) delays the progression of the activated McSCs to generate progeny in regeneration. |