
FIGURE
Figure 3
- ID
- ZDB-FIG-220518-56
- Publication
- Santacà et al., 2022 - Learning and visual discrimination in newly hatched zebrafish
- Other Figures
- All Figure Page
- Back to All Figure Page
Figure 3
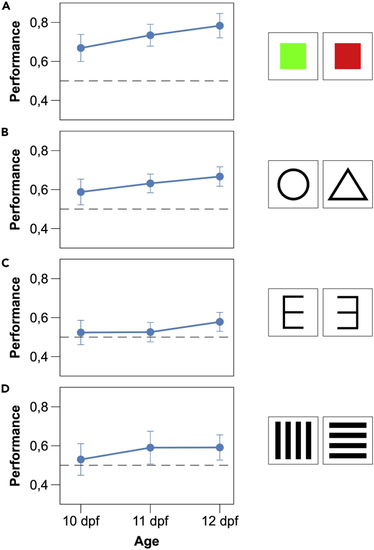
Results of Experiment 2–5 Learning curves (proportion of the time spent in the compartment with the reinforced stimulus) of zebrafish larvae in the three days of individual training of Experiment 2-5 (A: color discrimination; B: shape discrimination; C: mirror-image discrimination; D: horizontal-vertical discrimination). Data points represent mean ± SEM The dotted lines represent chance performance. |
Expression Data
Expression Detail
Antibody Labeling
Phenotype Data
Phenotype Detail
Acknowledgments
This image is the copyrighted work of the attributed author or publisher, and
ZFIN has permission only to display this image to its users.
Additional permissions should be obtained from the applicable author or publisher of the image.
Full text @ iScience