
Figure 2
- ID
- ZDB-FIG-220518-55
- Publication
- Santacà et al., 2022 - Learning and visual discrimination in newly hatched zebrafish
- Other Figures
- All Figure Page
- Back to All Figure Page
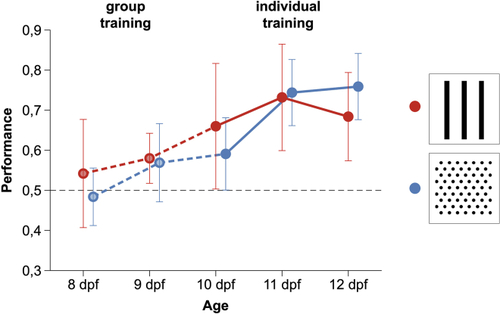
Learning performance in the five days of training (from 8 to 12 dpf) of Experiment 1 Performance was calculated as preference for the reinforced stimulus in the 90-min period preceding the delivery of the food reward. For the first two days of training (group training), preference is expressed as the proportion of larvae in the compartment with the reinforced stimulus. For the remaining three days (individual training), preference is expressed as the proportion of the time that a subject spent in the compartment with the reinforced stimulus. The figure shows distinct learning curves for subjects trained using vertical bars or a dot array as positive. Data points represent mean ± SEM The black dotted line represents chance performance. |