
FIGURE
Fig. 2
- ID
- ZDB-FIG-220516-42
- Publication
- Zou et al., 2022 - A High-Fat Diet Induces Muscle Mitochondrial Dysfunction and Impairs Swimming Capacity in Zebrafish: A New Model of Sarcopenic Obesity
- Other Figures
- All Figure Page
- Back to All Figure Page
Fig. 2
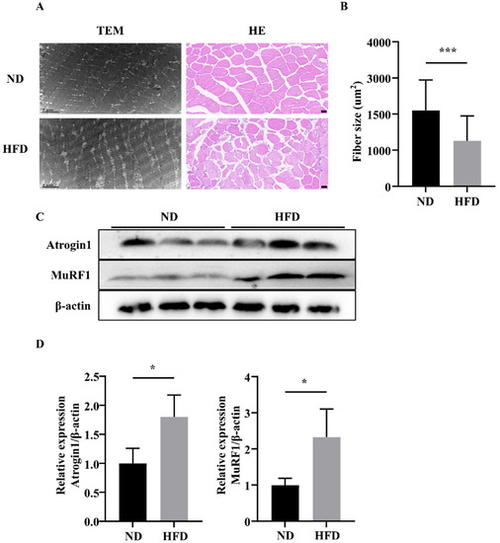
Figure 2. Comparison of skeletal muscle fiber size between zebrafish groups. (A) Representative photomicrographs of muscle sections stained H&E or imaged using transmission electron microscopy. (B) Average fiber size (based on H&E staining). (C,D) Atrogin-1 and MuRF1 protein expression. *, p < 0.05, ***, p < 0.001. Data represent means, and error bars represent standard errors of the means. Scale bars in transmission electron microscopy images, 2 μm. Scale bars in H&E-stained images, 20 μm. ND, normal diet; HFD, high-fat diet.
|
Expression Data
Expression Detail
Antibody Labeling
Phenotype Data
| Fish: | |
|---|---|
| Condition: | |
| Observed In: | |
| Stage: | Adult |
Phenotype Detail
Acknowledgments
This image is the copyrighted work of the attributed author or publisher, and
ZFIN has permission only to display this image to its users.
Additional permissions should be obtained from the applicable author or publisher of the image.
Full text @ Nutrients