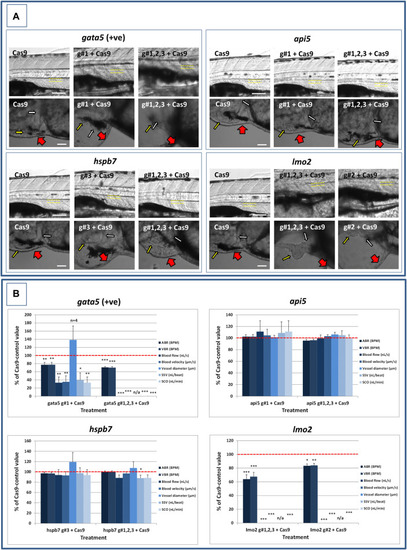
Results of the analysis of cardiovascular function in 4 dpf gata5 (positive control), api5, hspb7 and lmo2 zebrafish crispants versus the Cas9-injected control animals. (A): Images of example Cas9 control larvae alongside larvae treated with the two gRNAs + Cas9 mixtures giving the most robust phenotypes (as assessed at 2 dpf). Images are shown for gata5 crispants in the top left; for api5 in the top right; for hspb7 in the bottom left; and for lmo2 in the bottom right. In each case the top row shows the trunk vasculature with the position of the dorsal aorta outlined in yellow dashed lines, where blood flow and vessel diameter measurements were taken. The lower row of images shows the heart from the same animals, with the atrium highlighted by a small white arrow, and the ventricle by a small yellow arrow. The large red arrows show the position of the pericardial membrane and the extent of pericardial oedema. Most Cas9 control animals exhibited normal morphology and function in contrast with many of the crispants. (B): Cardiovascular functional endpoints quantified in the same groups of animals, with data shown for gata5 crispants in the top left; for api5 in the top right; for hspb7 in the bottom left; and for lmo2 in the bottom right. Note: the complete absence of blood flow measured in all of the gata5 g#1,2,3, and in 6/10 of the g#1-injected animals; and the absence of effective blood flow in the lmo2 g#1,2,3 and g#2-injected animals due to the absence of erythrocytes, meaning flow was not visible. Vessel diameter measurements were not possible in animals lacking blood flow (indicated by n/a). Data are shown as the mean % change versus the Cas9-control group (100% indicated by the red dashed line), ± SEM, n = 19–20 for the Cas9 and right-hand crispant treatment for each gene (data combined from two runs) and 10 for the left-hand treatment group for each gene where only one run was undertaken. *signifies a statistically significant difference versus the Cas9 control at p < 0.05, ** at p < 0.01, and *** at p < 0.001 (T-test or Mann Whitney U-tests for the combined guide injected groups, or 1-way ANOVA and Tukey’s HSD tests or Kruskal–Wallis and Dunn’s tests, for the single guide injected groups in which runs 1 and 2 were combined). The scale bar shown in the upper left-hand image of each panel represents 100 μm. The scale bar shown in the lower left-hand image of each panel represents 50 μm as a higher magnification camera mount was used in this case.
|
