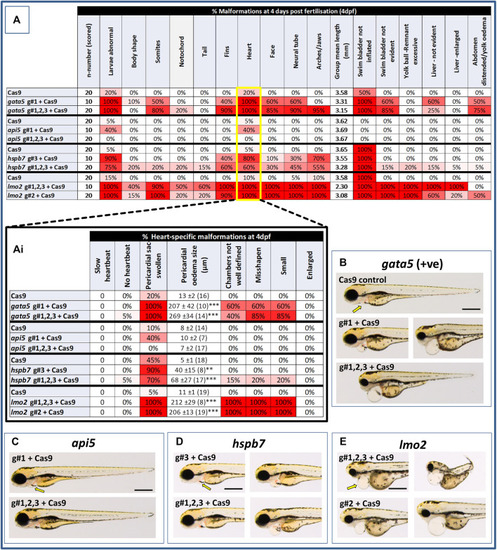
Results of the morphological analysis of 4 dpf gata5 (positive control), api5, hspb7 and lmo2 zebrafish crispants vs. the Cas9-injected control animals. Panel (A): General whole body morphological endpoints measured following injection of Cas9 alone, or after mutation of each of the genes assessed. Data are shown as the % incidence of abnormalities under each category, with shades from white (0%) through to red (100%) providing an indication of the proportion of animals exhibiting a malformation within that category. Note different n-numbers present as two runs were undertaken for the Cas9 control and the gRNA + Cas9-injected group showing the most robust phenotype from run 1 (for lmo2 g#2 was run twice due to concerns about excessive mortality in the g#1,2,3 group). The guide combination used for two runs in each case is shown in the lower panel of the example images for each gene. Ai: Expansion of heart-specific endpoints showing the full range scored including estimates of the size of pericardial oedema. Data are shown as the mean, ±SEM and (n = number of measures possible) for each treatment, For these data, **signifies a statistically significant difference vs. the Cas9 control at p < 0.01, and *** at p < 0.001 (t-test or Mann Whitney U-tests for the combined guide injected groups, or 1-way ANOVA and Tukey’s HSD tests or Kruskal–Wallis and Dunn’s tests for the single guide injected groups, in which run 1 and 2 data were combined). (B): example larvae following gata5 mutation vs. the Cas9-injected control. The yellow arrows indicate the position of the pericardial membrane and the extent of pericardial oedema, which was minimal in the controls but extensive in most crispant animals (two examples are shown for g#1-injected animals as there was some variability in the severities seen). (C–E): examples of larvae following knockout of each of the other genes assessed (note the apparent lack of effect of api5 mutation on general morphology). The scale bar shown in the first image of panels B–E represents 500 μm.
|
