FIGURE

Fig. 1.

ID
ZDB-FIG-220509-1
Publication
Lukowicz-Bedford et al., 2022 - Connexinplexity: The spatial and temporal expression of connexin genes during vertebrate organogenesis
Other Figures
All Figure Page
Back to All Figure Page
Fig. 1.

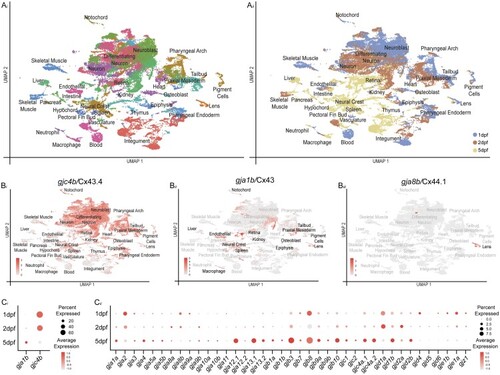
scRNA-seq dataset of zebrafish organogenesis and connexin expression. ai) Clustered cell types, where each dot represents a single cell and each color represents a set of transcriptionally related cells. aii) The age of animals from which cells were dissociated denoted by color—1 dpf cells are blue, 2 dpf cells are orange, and 5 dpf cells yellow. bi–biii) Expression of well-studied connexins in the dataset, where gray represents low expression and red represents the highest level of expression. bi) gjc4b/Cx43.4 is expressed broadly across the dataset. bii) gja1b/Cx43 is expressed in a large number of clusters, with notable patterns in liver, endothelial, macrophage, neural crest, spleen, retina, kidney, epiphysis, osteoblast, mesoderm, tailbud, pigment cells and lens clusters. biii) gja8b/Cx44.1 is expressed in lens clusters. ci) Broadly expressed connexins, gja1b/Cx43 and gjc4b/Cx43.4 and (cii) the remaining connexin family shown for each sampled time point. Here, all cells from the corresponding age are pooled and the percent of cells expressing a given connexin are represented through dot size while the relative expression level is denoted through color intensity.

Expression Data

Expression Detail
Antibody Labeling
Phenotype Data

Phenotype Detail
Acknowledgments
This image is the copyrighted work of the attributed author or publisher, and ZFIN has permission only to display this image to its users. Additional permissions should be obtained from the applicable author or publisher of the image. Full text @ G3 (Bethesda)