FIGURE SUMMARY
Title

Connexinplexity: The spatial and temporal expression of connexin genes during vertebrate organogenesis

Authors
Lukowicz-Bedford, R.M., Farnsworth, D.R., Miller, A.C.
Source
Full text @ G3 (Bethesda)

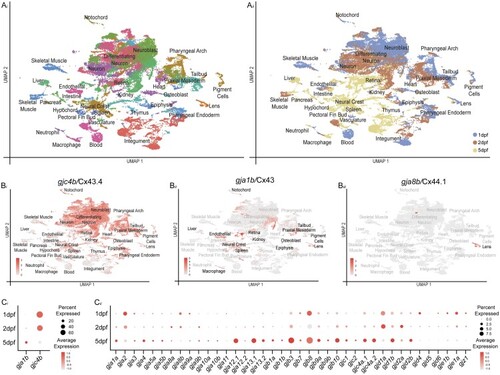
scRNA-seq dataset of zebrafish organogenesis and connexin expression. ai) Clustered cell types, where each dot represents a single cell and each color represents a set of transcriptionally related cells. aii) The age of animals from which cells were dissociated denoted by color—1 dpf cells are blue, 2 dpf cells are orange, and 5 dpf cells yellow. bi–biii) Expression of well-studied connexins in the dataset, where gray represents low expression and red represents the highest level of expression. bi) gjc4b/Cx43.4 is expressed broadly across the dataset. bii) gja1b/Cx43 is expressed in a large number of clusters, with notable patterns in liver, endothelial, macrophage, neural crest, spleen, retina, kidney, epiphysis, osteoblast, mesoderm, tailbud, pigment cells and lens clusters. biii) gja8b/Cx44.1 is expressed in lens clusters. ci) Broadly expressed connexins, gja1b/Cx43 and gjc4b/Cx43.4 and (cii) the remaining connexin family shown for each sampled time point. Here, all cells from the corresponding age are pooled and the percent of cells expressing a given connexin are represented through dot size while the relative expression level is denoted through color intensity.

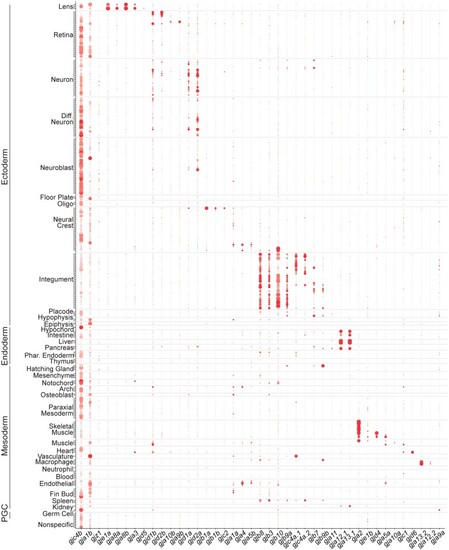
Connexin expression during zebrafish organogenesis. Clusters are organized by annotations and grouped into tissues and germ layers denoted on the y-axis. Along the x-axis, connexins are arranged based on spatial expression patterns. Each dot represents a single cluster. The percent of cells expressing a given connexin are represented through dot size while the relative expression level is denoted through color intensity. Diff. Neuron, differentiating neuron; Oligo, oligodendrocyte; Phar. Endoderm, pharyngeal endoderm; Arch, pharyngeal arch; PGC, primordial germ cell.

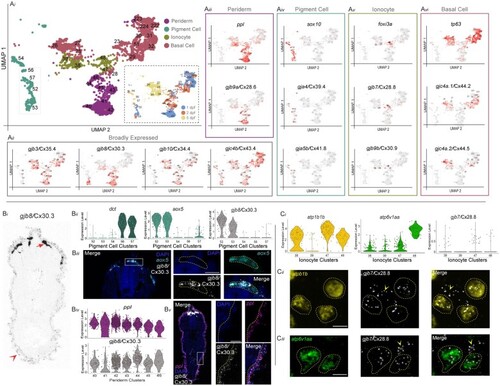
Connexin expression in the zebrafish integument during organogenesis. ai) The developing integument includes periderm, pigment cells, ionocytes, and basal cells. Relevant integument clusters were subsetted from the scRNA-seq dataset. Inset shows the age of animals from which cells were dissociated. aii) Four connexins are broadly expressed in integument clusters, gjb3/Cx35.4, gjb8/Cx30.3, gjb10/Cx34.4, and gjc4b/Cx43.4. Gray represents low expression and red represents the highest level of expression. aiii) Periderm marker ppl and gjb9a/Cx28.6 are expressed in clusters 40–46. aiv) Neural crest-derived pigment cell marker sox10 and gja4/Cx39.4 are expressed in clusters 52–57, while gja5b/Cx41.8 is only expressed in clusters 54 and 56. av) Ionocyte marker foxi3a and gjb7/Cx28.8 are expressed in clusters 38, 39, 47, and 48. avi) Basal cell marker tp63 and gjc4a.1/Cx44.2 are expressed in clusters 23, 25–32, 51, 222–224, while gjc4a.2/Cx44.5 is only expressed in clusters 25–29. bi) Fluorescent RNA in situ for gjb8/Cx30.3 in a transverse cross-section of a 1 dpf zebrafish embryo, contrast is inverted for clarity. Dorsal is up, section is from the trunk. Strong expression of gjb8/Cx30.3 in neural crest cells is denoted with arrow and weaker, but distinct, periderm expression is denoted with arrowhead. bii) Within the pigment cell clusters the melanocyte marker dct is expressed in clusters 56 and 57, whereas xanthophore marker aox5 is primarily expressed in clusters 52 and 53. gjb8/Cx30.3 is predominantly expressed in clusters 52 and 53. biii) Transverse cross-section of a 1 dpf zebrafish embryo stained with DAPI (blue) and fluorescent RNA in situ against aox5 (cyan) and gjb8/Cx30.3 (white), with white box denoting the zoomed panels at the right. Scale bar = 10 µM. biv) Expression of ppl and gjb8/Cx30.3 within the periderm clusters. bv) Transverse cross-section of a 1 dpf zebrafish embryo stained with DAPI (blue) and fluorescent RNA in situ against ppl (purple) and gjb8/Cx30.3 (white) with white box denoting the zoomed panels at the right. ci) Within the ionocyte clusters the Na+,K+-ATPase-rich cell and H+-ATPase-rich cell markers atp1b1b and atp6v1aa, respectively, are expressed in conjunction with low expression of gjb7/Cx28.8. cii) Fluorescent RNA in situ in a 1 dpf zebrafish embryo against atp1b1b (yellow), gjb7/Cx28.8 (white), with merged signal (right). atp1b1b expressing cells are outlined with a dashed yellow line, and gjb7/Cx28.8 signal outside of those cells are marked with yellow arrowhead. Scale bar = 10 µM. ciii) Fluorescent RNA in situ in a 1 dpf zebrafish embryo against atp6v1aa (green), gjb7/Cx28.8 (white), with merged signal (right). atp6v1aa expressing cells are outlined with a dashed yellow line, and gjb7/Cx28.8 signal outside of those cells are marked with yellow arrowhead. Scale bar = 10 µM.

Acknowledgments
This image is the copyrighted work of the attributed author or publisher, and ZFIN has permission only to display this image to its users. Additional permissions should be obtained from the applicable author or publisher of the image. Full text @ G3 (Bethesda)