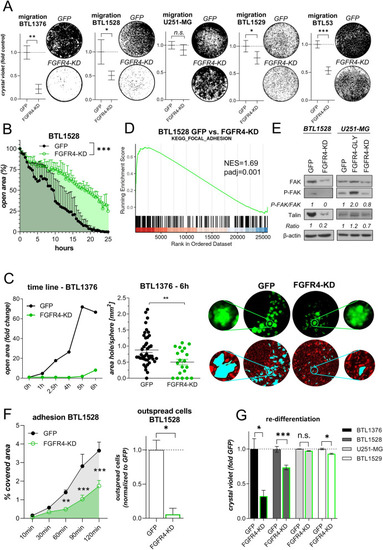
FGFR4 inactivation attenuates GBM cell migration, endothelial invasion, and adhesion. A Filter-migration of FGFR4-KD(K504M)- and GFP-transduced GBM sublines is shown (mean ± SEM from three experiments). Representative photographs are depicted. B Wound-healing capacities of BTL1528 FGFR4-KD(K504M)- and GFP-transduced cells were evaluated (means ± SEM of one representative experiment in triplicates). C Trans-endothelial invasion capacity of FGFR4-KD(K504M)- and GFP-transduced BTL1376 neurospheres into m-cherry-tagged blood endothelial cells (BEC) was evaluated by live-cell microscopy (left). Generated “wounds” after 6 h co-culture were normalized to the respective sphere sizes (middle). Representative photomicrographs of tumor spheres (GFP), BEC (m-cherry) and invasion wounds (highlighted in turquoise) are depicted (right).DKEGG_FOCAL_ADHESION gene set from GSEA analyses of BTL1528 GFP versus FGFR4-KD(K504M) cells is shown. E FAK expression and phosphorylation and talin expression in the indicated FGFR4-modulated GBM sublines compared to GFP-transduced controls was detected by Western blotting with β-actin as loading control. Ratios were calculated by normalization to β-actin and are shown as fold change to GFP-transduced cells. F Adhesion capacities of BTL1528 FGFR4-KD(K504M) and GFP control cells as percentage of well surfaces covered with cells (means ± SEM of three experiments) (left). Outspread cells (120 min) were counted microscopically (normalized to GFP control cells) (right).G Re-differentiation capacity of the indicated GBM spheroids from FGFR4-KD(K504M) cells normalized to the respective GFP controls are shown (mean ± SEM from three experiments). Statistical analyses: Student’s t-tests (A),(C middle; F right); area under the ROC curve analysis (B); 2-way ANOVA/Bonferroni correction (F left, G). *p < 0.05, **p < 0.01, ***p < 0.001, n.s. = not significant; NES = normalized enrichment score, padj = adjusted p-value
|
