FIGURE SUMMARY
Title

Fibroblast growth factor receptor 4 promotes glioblastoma progression: a central role of integrin-mediated cell invasiveness

Authors
Gabler, L., Jaunecker, C.N., Katz, S., van Schoonhoven, S., Englinger, B., Pirker, C., Mohr, T., Vician, P., Stojanovic, M., Woitzuck, V., Laemmerer, A., Kirchhofer, D., Mayr, L., LaFranca, M., Erhart, F., Grissenberger, S., Wenninger-Weinzierl, A., Sturtzel, C., Kiesel, B., Lang, A., Marian, B., Grasl-Kraupp, B., Distel, M., Schüler, J., Gojo, J., Grusch, M., Spiegl-Kreinecker, S., Donoghue, D.J., Lötsch, D., Berger, W.
Source
Full text @ Acta Neuropathol Commun

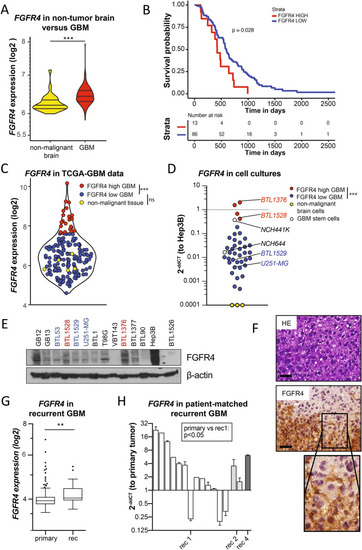
FGFR4 is overexpressed in a highly aggressive GBM subgroup, associated with tumor recurrence. AFGFR4 mRNA levels in non-tumor brain (n = 28) and GBM (n = 219) in the REMBRANDT dataset are shown as violin plots. B Kaplan Meier survival analysis of GBM patients from the REMBRANDT dataset stratified for FGFR4 expression (n = 99.) CFGFR4 mRNA levels in non-malignant brain (yellow, n = 5), low- (blue, n = 147), and high- (red, n = 22) expressing GBM subgroups of the TCGA-GBM RNA sequencing data. DFGFR4 mRNA levels detected by qRT-PCR in GBM (n = 40), glioblastoma stem cells (n = 2, white) models, and non-malignant brain tissue extracts (n = 3, yellow) are shown relatively to Hep3B positive control (2−ddCT). FGFR4high and FGFR4low GBM models selected for further analyses are highlighted, respectively. E Detection of FGFR4 (several bands due to increasing glycosylation) in membrane-enriched fractions from selected GBM cell models and Hep3B by Western blot, with β-actin as loading control. F FGFR4 IHC staining of BTL1376 tumor material is opposed to haematoxilin eosin (HE) stain. Scale bars: 50 µm. GFGFR4 mRNA data (TCGA-GBM-HG-U133A) of primary (n = 497) and recurrent (n = 16) GBM are visualized. HFGFR4 mRNA levels in patient-matched primary GBM (n = 14) and sequential recurrences (rec1, n = 13; rec2, n = 2; rec4, n = 1). Statistical analyses: log-rank test B; Wilcoxon test C; maximization of the t-statistics D; Student’s t-tests A,G,H;. n.s. = not significant,  *p < 0.05, **p < 0.01, ***p < 0.001

FGFR4 overexpression promotes GBM aggressiveness. A Volcano blot showing differentially expressed genes (DEGs) of TCGA-GBM RNA sequencing data in FGFR4high (red) versus FGFR4low (blue) GBM. Top 15 genes are annotated and FGF19 is highlighted. Adjusted p-value < 0.05. B Gene sets significantly enriched in the FGFR4high GBM subgroup are indicated. GSEA of DEGs (in A) were performed. Selected gene ontologies are plotted. C Scheme of the FGFR4-388Gly-GFP protein. (D + E) Clonogenicity D and proliferation capacity E of the FGFR4-388Gly-overexpressing and GFP-transduced, endogenously FGFR4low GBM models are shown (means ± SEM from three independent experiments). F Filter-migration capacities of FGFR4-388Gly-overexpressing normalized to GFP-transduced endogenously FGFR4low GBM models are shown (mean ± SEM from three experiments). Representative photographs are shown. G Wound-healing capacity of FGFR4-388Gly-overexpressing and GFP-transduced U251-MG cells in response to FGF19 stimulation (50 ng/ml) is shown at the indicated time points. Results were normalized to the respective FGF19-unstimulated conditions (means ± SD from three experiments). Red asterisks: Significance FGF19-stimulated versus -unstimulated. Statistical analyses: 2-way ANOVA/Bonferroni correction in D,E,G; Student ‘s t-tests in (F). *p < 0.05, **p < 0.01, ***p < 0.001, ns = not significant

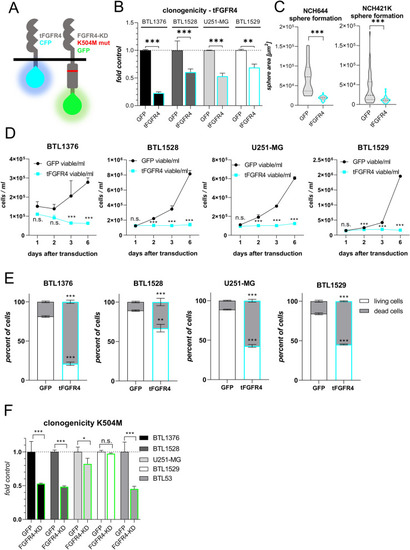
Inactivation of FGFR4 reduces proliferative capacity and promotes cell death. A Schemes of the kinase domain-truncated, CFP-coupled tFGFR4 (left) and of the point-mutated (mut), kinase-dead FGFR4-KD(K504M) (right), GFP-coupled proteins are shown. (B + F) Clonogenicity upon tFGFR4B, FGFR4-KD(K504M)(F) compared to GFP(B + F, set to 1) transduction was analyzed in endogenously FGFR4high (BTL1376, BTL1528) or FGFR4low (U251-MG, BTL1529, BTL53) cell models (mean ± SD from three experiments). C Sphere formation potential of GSC models upon tFGFR4 or GFP transduction (mean ± 25%CI). D Survival/proliferation capacities over time are shown for tFGFR4- and GFP-transduced GBM models. For each model, one representative out of three experiments in duplicates is depicted. E Cell death induction upon tFGFR4 or GFP transduction in GBM models after 3 days. Annexin/PI staining was analyzed by flow cytometry. Significance levels were calculated comparing tFGFR4- to GFP-transduced cells on the respective living or dead fraction. Statistical analyses: 2-way ANOVA/Bonferroni correction (mean ± SD) (B,D,E,F); Student’s t-tests (C). *p < 0.05, **p < 0.01, ***p < 0.001, n.s. = not significant

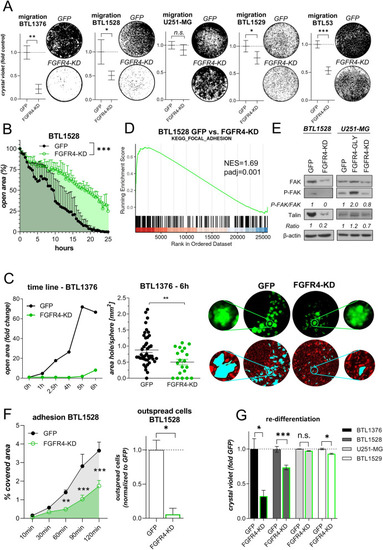
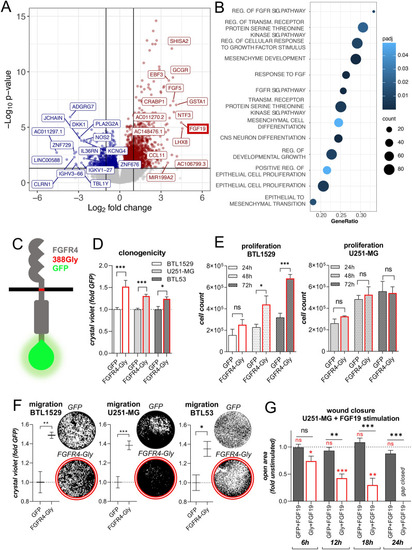
FGFR4 inactivation attenuates GBM cell migration, endothelial invasion, and adhesion. A Filter-migration of FGFR4-KD(K504M)- and GFP-transduced GBM sublines is shown (mean ± SEM from three experiments). Representative photographs are depicted. B Wound-healing capacities of BTL1528 FGFR4-KD(K504M)- and GFP-transduced cells were evaluated (means ± SEM of one representative experiment in triplicates). C Trans-endothelial invasion capacity of FGFR4-KD(K504M)- and GFP-transduced BTL1376 neurospheres into m-cherry-tagged blood endothelial cells (BEC) was evaluated by live-cell microscopy (left). Generated “wounds” after 6 h co-culture were normalized to the respective sphere sizes (middle). Representative photomicrographs of tumor spheres (GFP), BEC (m-cherry) and invasion wounds (highlighted in turquoise) are depicted (right).DKEGG_FOCAL_ADHESION gene set from GSEA analyses of BTL1528 GFP versus FGFR4-KD(K504M) cells is shown. E FAK expression and phosphorylation and talin expression in the indicated FGFR4-modulated GBM sublines compared to GFP-transduced controls was detected by Western blotting with β-actin as loading control. Ratios were calculated by normalization to β-actin and are shown as fold change to GFP-transduced cells. F Adhesion capacities of BTL1528 FGFR4-KD(K504M) and GFP control cells as percentage of well surfaces covered with cells (means ± SEM of three experiments) (left). Outspread cells (120 min) were counted microscopically (normalized to GFP control cells) (right).G Re-differentiation capacity of the indicated GBM spheroids from FGFR4-KD(K504M) cells normalized to the respective GFP controls are shown (mean ± SEM from three experiments). Statistical analyses: Student’s t-tests (A),(C middle; F right); area under the ROC curve analysis (B); 2-way ANOVA/Bonferroni correction (F left, G). *p < 0.05, **p < 0.01, ***p < 0.001, n.s. = not significant; NES = normalized enrichment score, padj = adjusted p-value

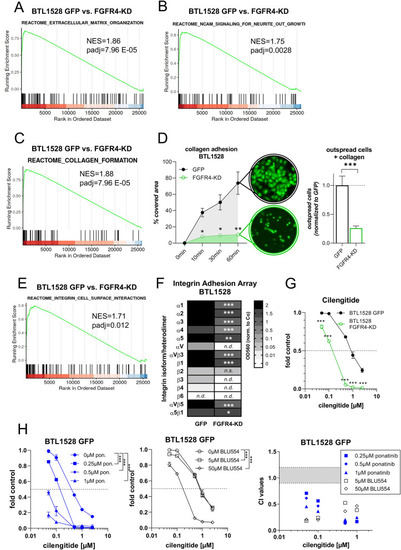
FGFR4 blockade results in loss of GBM cell adhesion and sensitizes towards the RGD-mimetic cilengitide. A-C,EREACTOME gene sets enriched in BTL1528 GFP versus FGFR4-KD(K504M) gene expression data based on GSEA. NES = normalized enrichment score, padj = adjusted p-value. D Adhesion capacities of BTL1528 FGFR4-KD(K504M) and respective GFP cells towards collagen as percentage of cell-coated well surfaces (means ± SEM of three experiments (left). Exemplary photomicrographs are shown. Outspread cells after 60 min were counted microscopically and data normalized to GFP control cells (right).F Integrin-mediated cell adhesion arrays of FGFR4-KD(K504M)- and GFP-transduced BTL1528 subclones are shown (means of two experiments). (G + H) Viability of BTL1528 FGFR4-KD(K504M)- and GFP-expressing GBM cells in response to single-agent cilengitide (G), combined-agent cilengitide + ponatinib (pon.) (H left) and cilengitide + BLU554 (H middle) was evaluated by MTT assays. For each panel, one representative out of three experiments is shown as mean ± SD from triplicates. Combination indices (CI) are given for selected drug concentrations combining cilengitide with ponatinib (blue) or BLU554 (black) (H right). CI values < 0.9 were considered synergistic [22]. Statistical analyses: 2-way ANOVA/Bonferroni correction (D left, F–H), Student’s t-tests (D right). *p < 0.05, **p < 0.01, ***p < 0.001, n.s. = not significant, n.d. = not detected

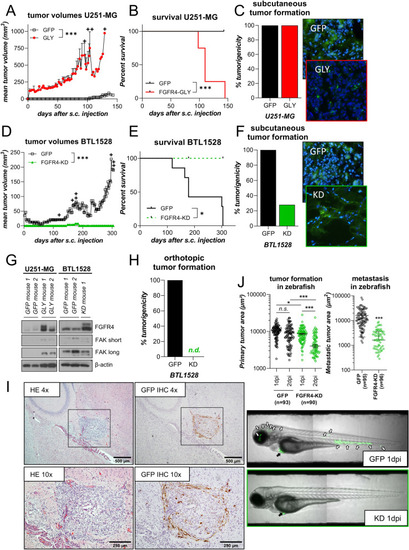
FGFR4 impacts on tumorigenicity and tumor growth. A-F SCID/CB17 mice were subcutaneously injected with wild-type FGFR4-388Gly-expressing, endogenously FGFR4low U251-MG cells or GFP-transduced controls (n = 4/group) (A-C) or kinase-dead FGFR4-KD(K504M)-expressing, endogenously FGFR4high BTL1528 cells or GFP-transduced controls (n = 7/group) D-F. Tumor growth curves (mean tumor volume ± SEM). +  = mouse sacrificed (A/D), Kaplan Meier survival curves (B/E), tumor take (C/F, left), and representative cryo-sections of DAPI stained tumor xenografts (C/F, right) are shown. G Western blot analysis of the indicated proteins in U251-MG (left) or BTL1528 (right) FGFR4-altered xenografts (compare panels A-F). β-actin served as loading control. H Orthotopic tumor formation of BTL1528 GFP and FGFR4-modulated sublines in mice (n = 5/group) is shown. (I) Representative photomicrographs of a BTL1528 GFP orthotopic tumor stained with HE (left panels) or GFP by IHC (right panels). J Primary tumor area over time (left) and extra-primary tumor cell migration in zebrafish larvae (right) of BTL1528 GFP- or FGFR4-KD(K504M)-expressing models one-day post injection (dpi). Data from the independent experiments are shown. Representative photomicrographs of zebrafish larvae are depicted in the lower panels. black arrows: primary tumors, white arrows: extra-primary site tumor cell clusters; 2-way ANOVA (A + D; J left), log-rank (Mantel-Cox) test (B + E), or Student’s t-test (J right). n.d. = no detectable tumors, n.s. = not significant, *p < 0.05, ***p < 0.001. GLY = FGFR4-388Gly, KD = FGFR4-KD(K504M), s.c. = subcutaneous, short/long: exposure times

Acknowledgments
This image is the copyrighted work of the attributed author or publisher, and ZFIN has permission only to display this image to its users. Additional permissions should be obtained from the applicable author or publisher of the image. Full text @ Acta Neuropathol Commun