
FIGURE
Figure 1
- ID
- ZDB-FIG-220430-153
- Publication
- Arel et al., 2022 - The Effect of Hypothermia and Osmotic Shock on the Electrocardiogram of Adult Zebrafish
- Other Figures
- All Figure Page
- Back to All Figure Page
Figure 1
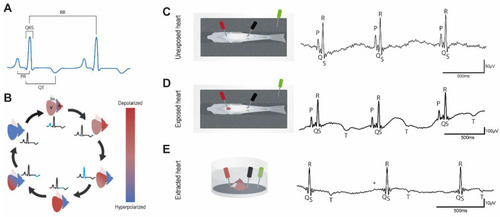
Figure 1. ECG representation and typical recordings; (A), Schematic representation of the interval measurement method. We chose to take the peak of the P and T waves to determine PR and QT intervals respectively to reduce the uncertainty of the measurements when taking before P waves or after T waves; (B), Cartoon representing the different depolarization and repolarization steps of the zebrafish heart cavities. A: atrium, V: ventricle, BA: bulbus arteriosus; (C–E), Schematic representation of the electrode positioning in the different configurations and representative traces; (C), Unexposed heart; (D), Exposed heart; (E), Extracted heart, * indicates putative P wave. Traces show three consecutive ECG complexes after application of a 50 Hz low-pass filter.
|
Expression Data
Expression Detail
Antibody Labeling
Phenotype Data
Phenotype Detail
Acknowledgments
This image is the copyrighted work of the attributed author or publisher, and
ZFIN has permission only to display this image to its users.
Additional permissions should be obtained from the applicable author or publisher of the image.
Full text @ Biology (Basel)