
FIGURE
Figure 5
- ID
- ZDB-FIG-220430-101
- Publication
- Yan et al., 2022 - Functional Study of TMEM163 Gene Variants Associated with Hypomyelination Leukodystrophy
- Other Figures
- All Figure Page
- Back to All Figure Page
Figure 5
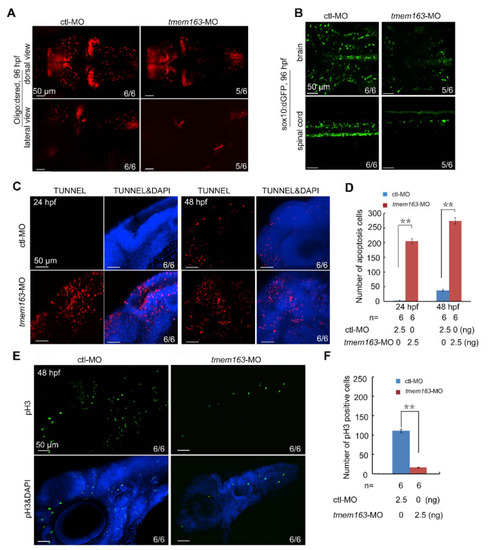
Figure 5. Loss of tmem163 leads to reduction of oligodendrocytes: (A) Fluorescent express pattern of oligo2:DsRed in larvae injected with control and tmem163-MO at 96 hpf (anterior to the left). The ratio of embryos with representative morphology was shown in the right corner of each picture. Scale bar: 50 μm. (B) Fluorescent express pattern of sox10:GFP in larvae injected with control and tmem163-MO at 96 hpf (anterior to the left). The ratios of affected embryos are indicated. Scale bar: 50 μm. (C) TUNNEL assay in embryos injected with control and tmem163-MO at 24 hpf and 48 hpf. Lateral views with the dorsal side pointing to the top. The ratios of affected embryos are indicated. Note the distinct increase in tmem163 morphants at the indicated stages. Scale bar: 50 μm. (D) Quantification of apoptosis cells (TUNEL-positive cells) in the hindbrain region calculated from six embryos. ** p < 0.01 (Student’s t-test). (E) Cell proliferation in tmem163 morphants is impaired as revealed by immunofluorescent stained with anti-phosphorylated H3 antibody (green) and DAPI (blue). The ratio of embryos with representative signals was shown in the right corner of each picture. Scale bar: 50 μm. (F) Quantification of proliferative cells (GFP-positive cells) in the hindbrain region calculated from six embryos. ** p < 0.01 (Student’s t-test).
|
Expression Data
Expression Detail
Antibody Labeling
Phenotype Data
| Fish: | |
|---|---|
| Knockdown Reagents: | |
| Observed In: | |
| Stage Range: | Prim-5 to Day 4 |
Phenotype Detail
Acknowledgments
This image is the copyrighted work of the attributed author or publisher, and
ZFIN has permission only to display this image to its users.
Additional permissions should be obtained from the applicable author or publisher of the image.
Full text @ Cells