|
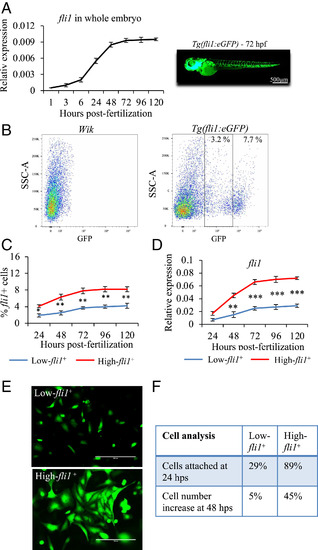
Characterization of low- and high-fli1+ cells. (A) qPCR analysis of fli1 gene expression during zebrafish development (from 1 to 120 hpf). (B) Following enzymatic disaggregation of Tg(fli1:EGFP)y1 zebrafish embryos at 72 hpf, two populations of low- and high-fli1+ cells were identified. Wik zebrafish were used to set the gate for fli1− cells. (C and D) Line graphs showing the percentage of low- and high-fli1+ cells at different developmental stages (C) and relative fli1 gene expression (D). (E) Fluorescent images of low- and high-fli1+ cells 24 h after seeded on fibronectin-coated dishes with endothelial growth medium. (F) Table of cell characterization (percent attached cells and cell number increase). n = 3 experiments; ANOVA test followed by Bonferroni post hoc was used to compare means. ***P ≤ 0.001, **P ≤ 0.01, *P ≤ 0.05.
|