FIGURE

Fig. 4

ID
ZDB-FIG-220416-34
Publication
Zarei et al., 2022 - High activity and high functional connectivity are mutually exclusive in resting state zebrafish and human brains
Other Figures
All Figure Page
Back to All Figure Page
Fig. 4

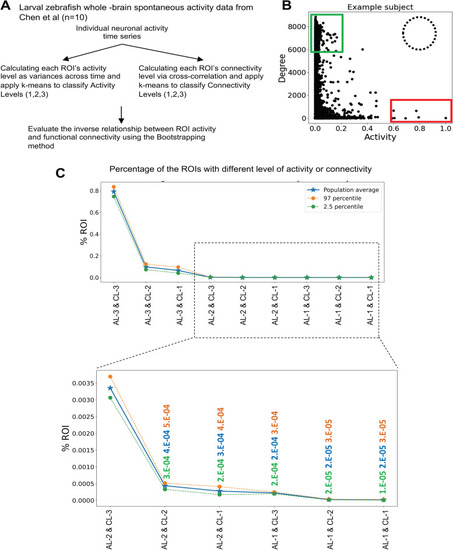
Non-overlapping distribution of highly active and highly connected neuronal populations in the whole larval zebrafish brain. A Schematic diagram showing the analysis pipeline applied to the whole brain spontaneous activity data from larval zebrafish (n=10). B Connectivity levels (Y-axis) of all neurons sorted based on their activity (X-axis) in an example subject. Red and blue boxes denote neurons of high activity and high functional connectivity, respectively. The dotted circle denotes where highly active and highly connected neurons are expected. C The population distribution curve of all neurons with different levels of activity and functional connectivity. Note that neurons that have high activity and high connectivity are non-existent. The number of replicates used is 10

Expression Data

Expression Detail
Antibody Labeling
Phenotype Data

Phenotype Detail
Acknowledgments
This image is the copyrighted work of the attributed author or publisher, and ZFIN has permission only to display this image to its users. Additional permissions should be obtained from the applicable author or publisher of the image. Full text @ BMC Biol.