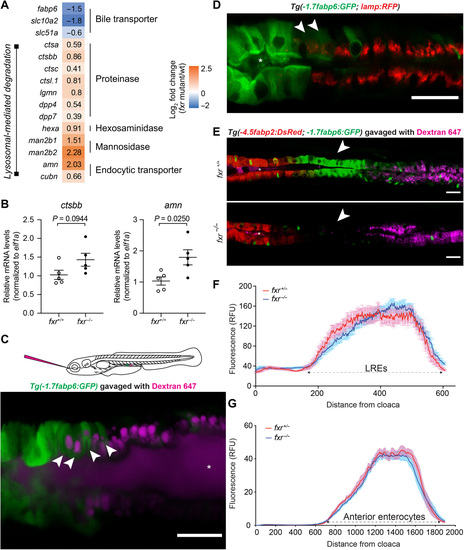
Fxr determines specific cell functions of ileal epithelial cells but is not required for establishment of regional boundaries.(A) Differential expression of genes related to bile metabolism and lysosomal functions in fxr−/− cells as compared to fxr+/+ cells in cluster 17. (B) qRT-PCR comparing expression of LRE markers in dissected intestines of gender- and size-matched adult fxr+/+ or fxr−/− zebrafish. The results are represented as relative expression levels normalized to the housekeeping gene ef1a (mean ± SEM). Statistical significance was calculated by unpaired t test. Representative data from two independent experiments are shown. (C) Confocal single-plane image of the intestinal epithelium in 7-dpf live larvae expressing the Tg(-1.7fabp6:GFP) transgene (green) following gavage with Alexa Fluor 647 dextran (magenta). White arrowheads mark GFP-expressing cells that uptake dextran. The schematic diagram depicting gavage approach for labeling lysosome-rich enterocytes (LREs) in the larval zebrafish intestine using fluorescent luminal cargo is shown in the top panel. Image is representative of six larvae examined. (D) Confocal three-dimensional projections of the intestinal epithelium of 7-dpf larvae expressing the Tg(-1.7fabp6:GFP) (green) and TgBAC(lamp2:RFP) (red) transgenes. White arrowheads mark cells showing both GFP and RFP (red fluorescent protein) expression. Image is representative of five larvae examined. (E) Confocal single-plane image of the intestinal epithelium in 7-dpf fxr+/+ (top) and fxr−/− (bottom) larvae expressing the Tg(-4.5fabp2:DsRed) (red) and Tg(-1.7fabp6:GFP) (green) transgenes following gavage with Alexa Fluor 647 dextran (magenta). White arrowheads mark the ileocyte region, which persists in fxr−/− larvae despite loss of GFP expression. Images are representative of five fxr+/+ and five fxr−/− larvae examined. Asteroids mark zebrafish lumen in (C) to (E). Scale bars, 25 μm. (F) Uptake profiles along LRE region following gavage with Alexa Fluor 647 dextran (1.25 mg/ml) in 7-dpf fxr+/− (n = 14) and fxr−/− (n = 22) larvae. (G) DsRed fluorescence along the intestine of 7-dpf fxr+/− (n = 18) and fxr−/− (n = 24) Tg(-4.5fabp2:DsRed) larvae.
|
