
Fig. 3.
- ID
- ZDB-FIG-220411-17
- Publication
- Crilly et al., 2022 - Zebrafish drug screening identifies candidate therapies for neuroprotection after spontaneous intracerebral haemorrhage
- Other Figures
- All Figure Page
- Back to All Figure Page
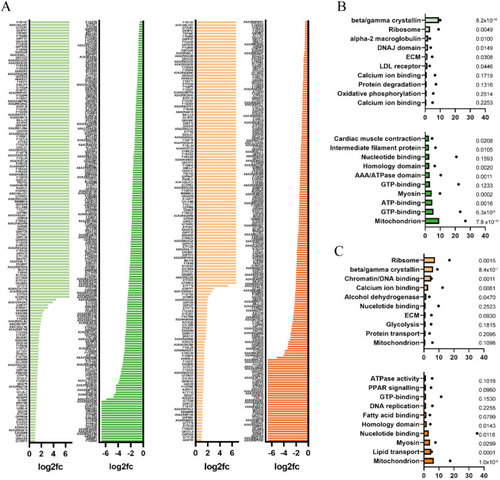
Proteomic analysis highlights several pathways associated with neuroprotection from ACE-I treatment. (A) Significant changes in protein expression levels in the heads (n=5) of ramipril (left, green)- and quinapril (right, orange)-treated larvae when compared to DMSO controls. (B,C) Functional annotation performed using Database for Annotation, Visualization and Integrated Discovery (DAVID) identified gene ontology, protein pathway and functional category similarities, and the top ten upregulated pathways (top) and downregulated pathways (bottom), compared to total background detection for ramipril (B) and quinapril (C). Classification stringency set to ‘medium’, similarity threshold=0.5. Bars represent enrichment score and points (•) are the number of proteins detected in that pathway. P-values are presented. |