|
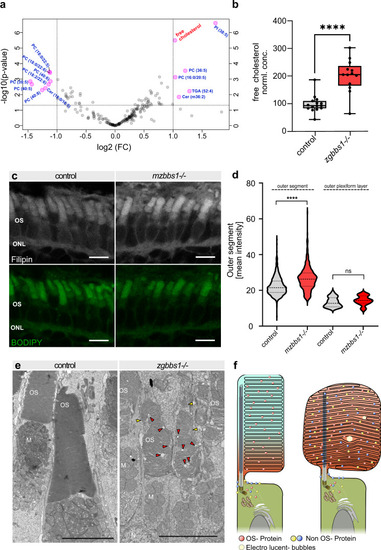
Loss of the BBSome affects the lipid composition of photoreceptor outer segments.a Volcano plot showing lipids that are significantly affected (P < 0.05 & FC > ± 2) in bbs1 mutant OSs, as identified by targeted lipidomics on isolated OSs of 5 month-old zgbb1−/− fish. MetaboAnalyst provides fold change analysis and P values following two-sided t test statistics. b Box & whisker plot highlighting the roughly twofold enrichment of free cholesterol seen in (a). Independent t test Benjamini- Hochberg corrected Significance: ****P = 3.18e-06; Error bars show the min/max values, boxes show the 25th to 75th percentile around the median. Each data point represents an individual fish (n = 15 Ctrl n = 13 Mut). c Accumulation of free cholesterol in 5 dpf mzbbs1−/− mutants (right image) is verified by staining with the free cholesterol fluorescent reporter Filipin-III (grey), co-stained with the membrane binding dye BODIPY (green). d Violin plot of the mean Filipin fluorescence intensity of single OSs (segmented in the BODIPY channel) shows that free cholesterol significantly accumulates in mutant OS compared to controls but not in the outer plexiform layer at 5 dpf. Mann–Whitney-Test on mean OS intensities: Sig: ****P < 0.0001; (n = 525 Mut OSs, n = 733 Ctrl OSs); Mann–Whitney-Test on mean OPL intensities: Sig: ns = P value 0.1844; (n = 38 Mut images, n = 49 Ctrl images). e TEM images of 5 month old zygotic mutants (right image) reveals dysmorphic OSs with loss of compact membrane stacking, vertical membrane discs (yellow arrowheads) and presence of electro-lucent spherical “bubbles” in the OS (red arrowheads). f Schematic summary of findings in this work, illustrating the altered protein and lipid content caused by Bbs1 loss. In the physiological situation (left image) the OSs have a tightly regulated protein and lipid composition, including a non-homogenous lipid distribution (blue-red gradient). In the bbs1−/− mutant OS (right image) accumulation of non-OS proteins is observed with altered lipid composition, including early accumulation of cholesterol. Morphological anomalies include abnormal OS membrane disc stacking resulting in bulky OSs and electro-lucent spherical “bubbles”. Scale Bars: (c) 5 µm; (e) 5 µm. Abbreviations: TEM transmission electron microscopy, M mitochondria, N nucleus, P pigment, OS outer segment, OPL outer plexiform layer.
|