|
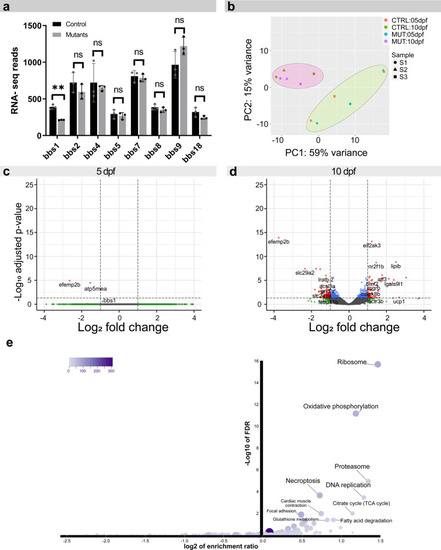
The retinal transcriptome is not primarily affected in <italic>bbs1</italic> mutants.Eye-specific transcriptomic analysis in 5 dpf and 10 dpf maternal zygotic bbs1−/− larvae and their sibling controls. a Bar plot of the normalized read counts of all BBSome components at 10 dpf shows a significant reduction in bbs1 mRNA, indicating mutation-induced mRNA decay. No significant alteration in mRNA levels of other BBSome components was observed, indicating that no transcriptional compensation effect occurs. Benjamini-Hochberg (BH) adjusted P values of Wald test; Sig: ** = adj. P value = 0.006.; Sample size (n = 3 samples for each condition, composed of a pool of >10 larvae); Error bars show standard deviation around the mean. b Principle component analysis of the Deseq2 normalized, variance-stabilizing transformed top 100 variable genes, shows large variability between sample pairs (batches) at 5 dpf and to a lesser extent at 10 dpf. c–d DE genes are visualized in volcano plots by their fold change (FC) (mutant over control) and their adjusted P value. To account for batch effects shown in (b), a paired sample design was considered in the differential expression (DE) analysis following the two-sided Wald test. In red are genes with an adjusted P < 0.05 and fold change >FC ± 2; in blue are genes with adj .P < 0.05 & FC between +2 and −2 and in green are genes with a FC > ± 2 but an adj. P > 0.05. c DE-analysis at 5 dpf reveals only two genes that are significantly changed; neither are associated to a known developmental or BBSome compensation pathway. d At 10 dpf several genes are significantly DE (red dots). e Over-representation analysis was used to group the genes that were DE at 10 dpf into functional groups using Webgestalt KEGG-pathway analysis. Several KEGG pathway terms associated with metabolic change and necroptosis were overrepresented in our data set. Abbreviations: CTRL control, MUT mutant, DE differential expression, FC fold change (mzbbs1−/− over control).
|