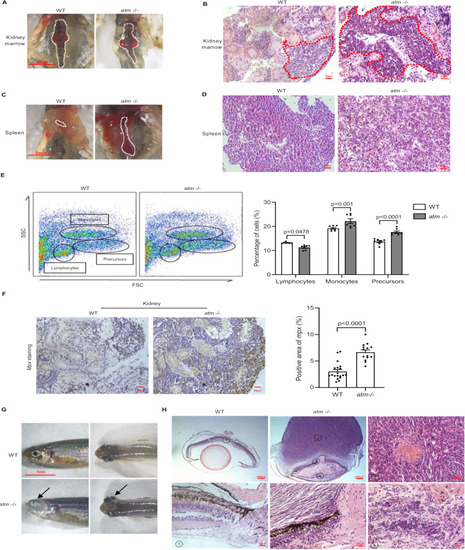
Tumorigenesis in atm−/− zebrafish. (A) Kidney marrow anatomy of WT and atm−/− zebrafish. (B) HE staining of kidney marrow shown in A. (C) Spleen of WT and atm−/− zebrafish. (D) HE staining of spleen shown in (C). (E) Flow cytometry analysis of cells extracted from the kidney of 12-month-old WT and atm−/− zebrafish (left). Quantification of percentage of lymphocytes, monocytes, and precursors (right) (n = 7 for each group). (F) Immunochemistry of kidney tumor from atm−/− fish compared to WT kidney (left). Quantification of mpx-positive signals area (right) (n = 19 for WT; n = 14 for atm−/−). (G) Neoplasm in the eyes of atm−/− zebrafish. (H) HE staining of neoplasm in the eyes of atm−/− zebrafish compared with the WT eyes. The statistical significance was analyzed using the two-tailed Student’s t-test. Data are shown in means ± SEM.