
- Title
-
Loss of atm in Zebrafish as a Model of Ataxia-Telangiectasia Syndrome
- Authors
- Chen, K., Wang, P., Chen, J., Ying, Y., Chen, Y., Gilson, E., Lu, Y., Ye, J.
- Source
- Full text @ Biomedicines
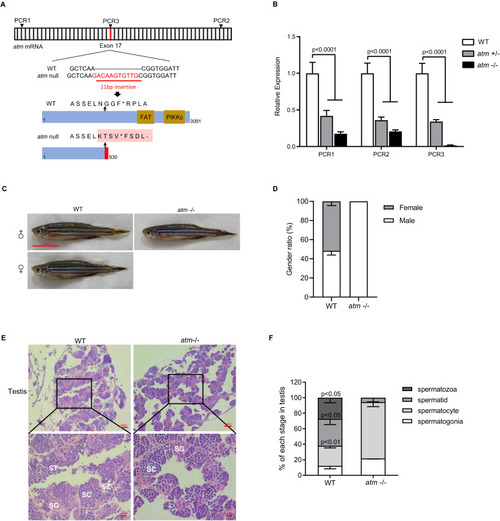
Mutant schema of atm and infertility phenotype. (A) Cas9-based engineering system of the atm introduced a stop code before functional domain. (B) Relative expression level of atm mRNA at different location (shown in (A)) of atm+/− and atm−/− zebrafish compared to WT (n = 3). (C) General observation of wild-type and atm−/− zebrafish at 6 months old. (D) Gender ratio of atm−/− compared with WT zebrafish (Over 50 fish each group were calculate). (E) HE stains of testis. SG, spermatogonia; SC, spermatocyte; ST, spermatid; SZ, spermatozoa. (F) Ratio of each stage of meiosis in atm−/− zebrafish testis compared to WT (n = 3). The statistical significance was analyzed using the two-tailed Student’s t-test. Data are shown as means ± SEM. |
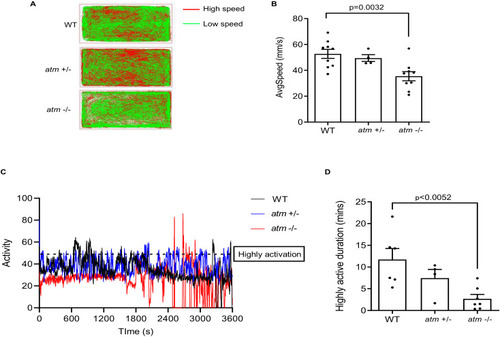
Behavior test of atm−/− zebrafish. (A) Trajectory diagram of 6-month-old WT, atm+/− and atm−/− zebrafish in 60-minue open-field tracking test. (B) Average speed of 6 months old WT, atm+/−, and atm−/− zebrafish in A (n = 9 for WT and atm−/−; n = 4 for atm+/-). (C) Activity diagram of WT, atm+/−, and atm−/− zebrafish in 60-minues open-field quantification test. (D) Highly activation duration of WT, atm+/−, and atm−/− zebrafish (n = 6 for WT; n = 7 for atm−/−; n = 4 for atm+/−). The statistical significance was analyzed using one-way ANOVA. Data are shown as means ± SEM. PHENOTYPE:
|
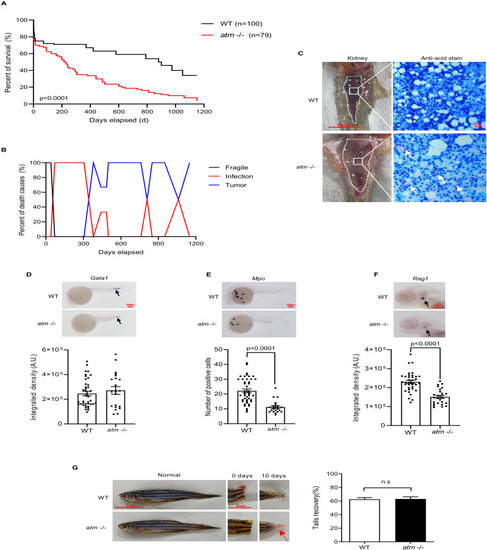
Loss of atm in zebrafish causing premature death, immunol deficiency, and regeneration abnormality. (A) Life span of WT and atm−/− zebrafish. (B) Causes of death in WT and atm−/− zebrafish. (C) Kidney marrow anatomy and anti-acid staining of infective tissue. (D–F) Whole-embryo in situ hybridization on atm−/− and WT zebrafish. (D) Representative images of gata1 expression (black arrows) in WT and atm−/− embryos at 24-hpf (top). Quantification of the gata1 signal (bottom) (n = 40 for WT; n = 21 for atm−/−). (E) Representative images of mpo expression (black arrow) in WT and atm−/− embryos at 24-hpf (top). Quantification of the mpo signals (bottom) (n = 45 for WT; n = 22 for atm−/−). (F) Representative images of rag1 expression (black arrow) in WT and atm−/− embryos at 5-dpf (top). Quantification of the rag1 signal (bottom) (n = 36 for WT; n = 26 for atm−/−). (G) General observation of regeneration ability of atm−/− zebrafish’s caudal fin amputation. Ratio of tail recovery is quantified (n = 12 for each group). The statistical significance is analyzed using the two-tailed Student’s t-test. Data are shown in means ± SEM. |
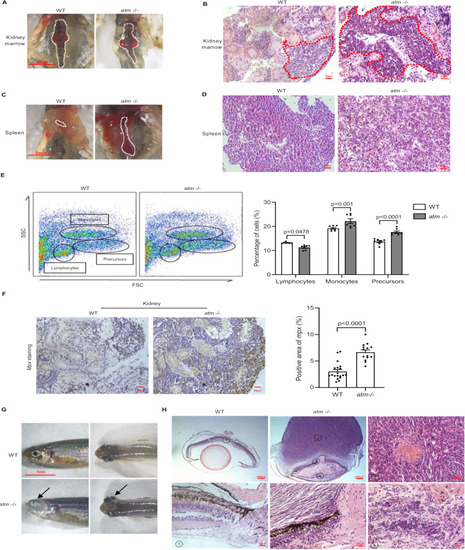
Tumorigenesis in atm−/− zebrafish. (A) Kidney marrow anatomy of WT and atm−/− zebrafish. (B) HE staining of kidney marrow shown in A. (C) Spleen of WT and atm−/− zebrafish. (D) HE staining of spleen shown in (C). (E) Flow cytometry analysis of cells extracted from the kidney of 12-month-old WT and atm−/− zebrafish (left). Quantification of percentage of lymphocytes, monocytes, and precursors (right) (n = 7 for each group). (F) Immunochemistry of kidney tumor from atm−/− fish compared to WT kidney (left). Quantification of mpx-positive signals area (right) (n = 19 for WT; n = 14 for atm−/−). (G) Neoplasm in the eyes of atm−/− zebrafish. (H) HE staining of neoplasm in the eyes of atm−/− zebrafish compared with the WT eyes. The statistical significance was analyzed using the two-tailed Student’s t-test. Data are shown in means ± SEM. |