
Figure 5.
- ID
- ZDB-FIG-220331-5
- Publication
- Peña et al., 2021 - TLR7 ligation augments hematopoiesis in Rps14 (uS11) deficiency via paradoxical suppression of inflammatory signalling
- Other Figures
- All Figure Page
- Back to All Figure Page
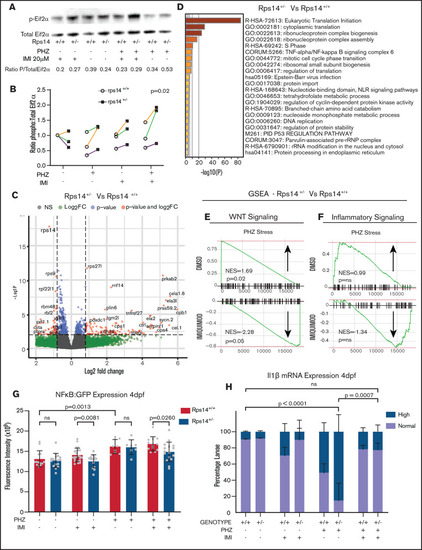
RNA sequencing analysis of HSPCs shows the effects on WNT and inflammatory signaling pathways. (A) Representative western blot of p-Eif2α (phosphoserine 51) and Eif2α total in Rp14 mutants at 6-dpf exposed to PHZ and/or imiquimod. (B) Normalized ratio (to untreated WT) of p-Eif2α/total Eif2α shown in 3 experiments, represented by different colored lines. The P-value refers to the effect of genotype on the ratio. (C) Differential gene expression of Rps14+/− vs Rps14+/+ embryos shown as a volcano plot for all conditions combined. Rps14 is shown in bold. (D) Metascape Pathway Analysis of Rps14+/− vs Rps14+/+ differentially expressed genes showing the top 20 enriched pathways. (E-F) GSEA analysis comparing Rps14+/− with Rps14+/+ in DMSO-treated vs imiquimod-treated HSPCs. (E) Negative regulation of WNT signaling was enriched in Rps14+/− vs Rps14+/+ DMSO-treated HSPCs, and the effect was reversed in imiquimod-treated HSPCs. (F) Similarly, inflammatory signaling was enriched in Rps14+/− vs Rps14+/+ DMSO-treated HSPCs but suppressed in imiquimod-treated HSPCs. (G) Quantification of total fluorescence of NFKβ/GFP at 4 dpf shows an increase with PHZ stress but a decrease with imiquimod in Rps14+/− compared with Rps14+/+. (H) PHZ causes an increase in il1b expression by in situ hybridization in Rps14+/− which is rescued by imiquimod. Statistical comparisons are by 2-way ANOVA (B,H; genotype and condition) or ANOVA (G). |
| Genes: | |
|---|---|
| Antibody: | |
| Fish: | |
| Conditions: | |
| Anatomical Term: | |
| Stage Range: | Day 4 to Day 6 |