
- Title
-
TLR7 ligation augments hematopoiesis in Rps14 (uS11) deficiency via paradoxical suppression of inflammatory signalling
- Authors
- Peña, O.A., Lubin, A., Hockings, C., Rowell, J., Jung, Y., Hoade, Y., Dace, P.E.I., Valdivia, L.E., Tuschl, K., Boiers, C., Virgilio, M., Richardson, S.E., Payne, E.M.
- Source
- Full text @ Blood Adv
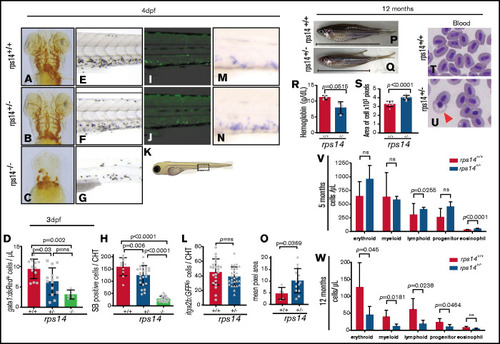
Rps14 stable mutants show dose-dependent effects on hematopoiesis in embryos. (A-C) Assessment of hemoglobinized cells with o-dianisidine staining. Ventral views of the head in 4-dpf embryos. Rps14−/− zebrafish showed profound loss of hemoglobinized cells (C) and developmental anomalies. Rps14+/− were indistinguishable from their WT siblings by microscopy (A-B). (D) Number of erythroid cells by flow cytometry of individual Tg(gata1:dsRed);Rps14+/− embryos at 3 dpf. There was an allelic dose-dependent effect on the dsRed-expressing number of cells. (E-G) SB-stained 4-dpf embryos for granulocytes. (H) Quantification of SB+ cells. (K) Region of CHT depicted in cartoon (adapted from Lizzy Griffiths with permission). SB staining shows an allelic dose-dependent effect of Rps14. (I-J) Lateral views of the CHT of 4dpf Rps14 mutant fish carrying the itga2b:GFP transgene, labeling HSPCs that reside in the CHT. (L) Quantitation of stationary GFPlo cells in the CHT. (M-N) Expression of c-myb by in situ hybridization in 4-dpf embryos. (O) In contrast to itga2b-GFP, c-myb expression is increased in the CHT, quantified by median expression intensity in CHT.58 (P-Q) Lateral views of 12-month-old adult fish show the decreased size of heterozygotes. The anterior faces left and the dorsal side faces upward. The horizontal line shows the body length excluding the tail. (R) Quantification of hemoglobin concentration. (S) Analysis of cell size. Red blood cells were significantly larger in Rps14+/− mutants compared with siblings. (T-U) Micrographs of blood smears from Rps14+/− and WT siblings; the arrowhead indicates poorly hemoglobinized erythroid cell in Rps14+/−. (V-W) Absolute number of cells per microliter of different cell types in the kidney marrow of 5- and 12-month-old fish, showing progressive differences between heterozygous rps14 mutants and their WT siblings. Statistical comparison by 1-way ANOVA with Tukey’s multiple-comparisons test (D,H) or unpaired Student t test. Original magnification x100 for panels T and U. EXPRESSION / LABELING:
PHENOTYPE:
|
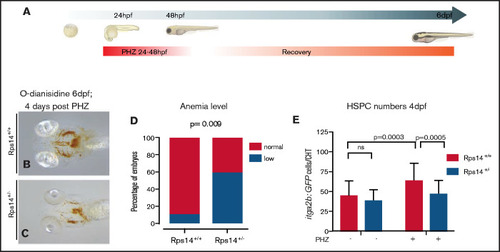
Hemolytic stress augments the hematopoietic phenotype in Rps14+/− mutants and is rescued by imiquimod. (A) Hemolytic stress experiment. (B-C) Representative views (ventral) of rps14+/+ and rps14+/− siblings treated as in panel A and stained with o-dianisidine at 6 dpf. Rps14+/− mutants demonstrate a clear anemic phenotype, quantified in panel D. (E) Effect of hemolytic stress on HSPCs. Statistical comparisons were performed with Fisher’s exact test (D) or ANOVA (E). |
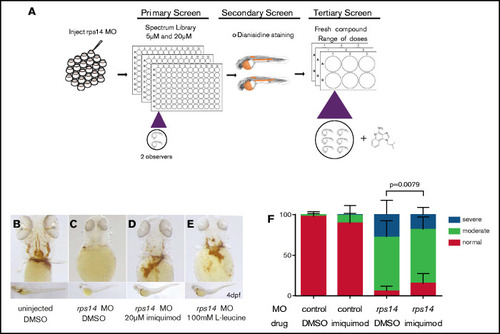
Small-molecule screening for modifiers of anemia in Rps14 deficiency identifies imiquimod. (A) The screening design. (B-E) Rps14 4-dpf morphants and controls treated with DMSO, l-leucine, or imiquimod were stained for hemoglobin with o-dianisidine. Ventral views of the head (top) and lateral (bottom) views, with the anterior facing left and the dorsal facing upward. (F) Semiquantitative analysis of the effects of imiquimod on the severity of hemoglobinization. Imiquimod improved the level of hemoglobinization compared with the DMSO control. Statistical comparisons performed by Fisher’s exact test. Original maginfication x80 for panels B-E. PHENOTYPE:
|

Imiquimod exerts its effect on Rps14-deficient anemic embryos via on-target activation of TLR7 (A-D) Ventral views of 6-dpf embryos stained with o-dianisidine, treated with PHS to induce hemolytic stress or with DMSO (A,C) or with PHZ and imiquimod (B,D). Imiquimod rescued stress-induced anemia. (F) Quantified as the normal/total ratio of embryos across 3 replicates at a concentration of 20 µM. (E) Effect of imiquimod analyzed across the dose range, analyzed by nonlinear regression. (G) Flow cytometric analysis of rps14E8fs;Tg(itga2b:GFP) single embryos exposed to hemolytic stress and then treated with DMSO or imiquimod. Imiquimod enhanced the itga2b:GFPlo cells, and the effect was most marked in the Rps14+/− embryos, where there was a significant interaction between the drug and genotype. (H-M) Ventral views of 6-dpf embryos stained with o-dianisidine, treated to induce hemolytic stress (PHZ) and with DMSO (H,K), gardiquimod (I,L), or motolimod (J,M). Gardiquimod, but not motolimod, rescued the stress-induced anemia in Rps14+/− embryos. (N) The gardiquimod rescue effect analyzed across dose range by nonlinear regression. Tlr7 knockout was validated using Miseq (O) and restriction enzyme digest with BplI (P), which digested only the WT. (Q) Knockout of Tlr7 abrogated the rescue of anemia by imiquimod. Original magnification x80. PHENOTYPE:
|
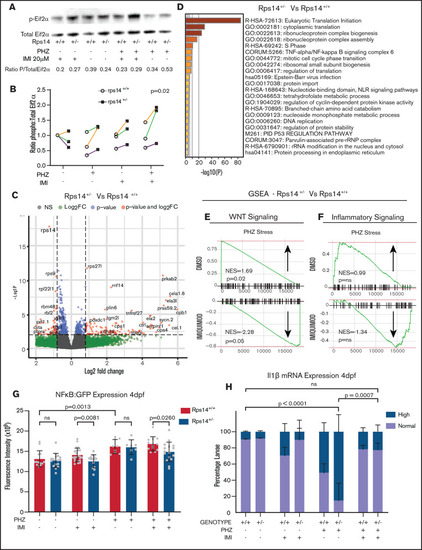
RNA sequencing analysis of HSPCs shows the effects on WNT and inflammatory signaling pathways. (A) Representative western blot of p-Eif2α (phosphoserine 51) and Eif2α total in Rp14 mutants at 6-dpf exposed to PHZ and/or imiquimod. (B) Normalized ratio (to untreated WT) of p-Eif2α/total Eif2α shown in 3 experiments, represented by different colored lines. The P-value refers to the effect of genotype on the ratio. (C) Differential gene expression of Rps14+/− vs Rps14+/+ embryos shown as a volcano plot for all conditions combined. Rps14 is shown in bold. (D) Metascape Pathway Analysis of Rps14+/− vs Rps14+/+ differentially expressed genes showing the top 20 enriched pathways. (E-F) GSEA analysis comparing Rps14+/− with Rps14+/+ in DMSO-treated vs imiquimod-treated HSPCs. (E) Negative regulation of WNT signaling was enriched in Rps14+/− vs Rps14+/+ DMSO-treated HSPCs, and the effect was reversed in imiquimod-treated HSPCs. (F) Similarly, inflammatory signaling was enriched in Rps14+/− vs Rps14+/+ DMSO-treated HSPCs but suppressed in imiquimod-treated HSPCs. (G) Quantification of total fluorescence of NFKβ/GFP at 4 dpf shows an increase with PHZ stress but a decrease with imiquimod in Rps14+/− compared with Rps14+/+. (H) PHZ causes an increase in il1b expression by in situ hybridization in Rps14+/− which is rescued by imiquimod. Statistical comparisons are by 2-way ANOVA (B,H; genotype and condition) or ANOVA (G). EXPRESSION / LABELING:
PHENOTYPE:
|
|