|
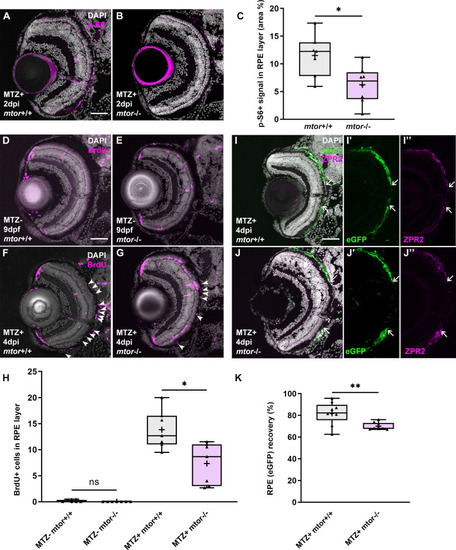
Mutation in <italic toggle='yes'>mtor</italic> impairs RPE regeneration.(A,B) Immunofluorescent images of p-S6 staining on transverse cryosections from ablated mtor+/+ and mtor-/- at 2dpi. Nuclei (white), p-S6 (magenta). (C) Quantification of the p-S6 signal in the RPE layer revealed a significant decrease in MTZ+mtor-/- larvae, when compared to MTZ+mtor+/+ siblings. (D,E) Immunofluorescent images of BrdU staining on transverse cryosections from MTZ- (D,E) and MTZ+ (F,G) mtor+/+ and mtor-/- larvae at 9dpf/4dpi Nuclei (white), BrdU (magenta). (H) Quantification of BrdU+ cells in the RPE layer showed no significant differences between MTZ-mtor+/+ and mtor-/- larvae, but a significant decrease in MTZ+mtor-/- larvae when compared to MTZ+mtor+/+ siblings. (I-J) Immunofluorescent images of ZPR2 staining on transverse cryosections from MTZ+mtor+/+ and mtor-/- larvae at 4dpi. Single channel (I’ J’) rpe65a:nfsB-eGFP images and (I” J”) ZPR2 images. Nuclei (white), eGFP (green), ZPR2 (magenta). White arrows highlight the edges of eGFP or ZPR2 recovery in the RPE. (K) Quantification of the eGFP expression recovery showed a significant decrease in MTZ+mtor-/- larvae, compared to mtor+/+siblings. p-values: * ≤ 0.05, ** ≤ 0.01. Statistical information can be found in S9 Table. Dorsal is up and distal is left. Scale bar = 50μm.
|