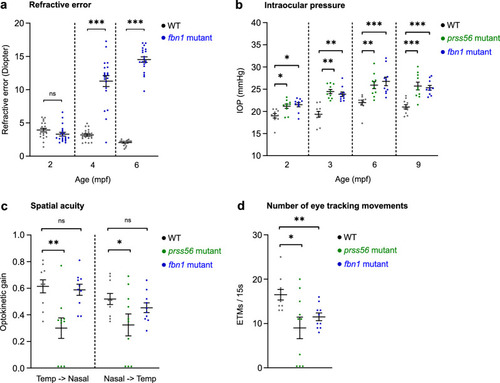
Prss56 and fbn1 mutants show an altered refractive status, IOP, and visual capability. Measurements of refractive error, IOP, and the capability for spatial vision. (a) The loss of fbn1 resulted into a hyperopic shift of the refractive status at 4 mpf (effect size = +8D; P < 0.001) and 6 mpf (effect size = +12D; P < 0.001), relative to WT (n = 20 eyes per timepoint). (b) IOP measured by rebound tonometer (n = 10 eyes per timepoint). Prss56 and fbn1 mutants both showed significantly increased IOP values relative to WT at 2, 3, 6, and 9 mpf. (c, d) OKRs measured in 6 mpf prss56 and fbn1 mutants (n = 10 fish). An n = 3 prss56 mutants showed no detectable optokinetic nystagmus patterns. The visual capability (c) was indicated by the optokinetic gain, the ratio between eye velocity and stimulus velocity. The prss56 mutants showed a decrease in optokinetic gain for both temporal to nasal (left) and nasal to temporal (right) eye movements, relative to WT. The fbn1 showed no significant change in optokinetic gain. The number of ETMs/15 s (d) intervals was significantly decreased in both prss56 and fbn1 mutants. A baseline spatial frequency (0.15 cycles/degree) and drum velocity (20 degrees/second) were used. See Supplementary Table S2 for all statistics. Error bars: standard error of the mean. Significance: ns = not significant. *P < 0.05, **P < 0.01, ***P < 0.001.
|
