FIGURE SUMMARY
Title

Zebrafish: An In Vivo Screening Model to Study Ocular Phenotypes

Authors
Quint, W.H., Tadema, K.C.D., Crins, J.H.C., Kokke, N.C.C.J., Meester-Smoor, M.A., Willemsen, R., Klaver, C.C.W., Iglesias, A.I.
Source
Full text @ Transl Vis Sci Technol

ZFIN is incorporating published figure images and captions as part of an ongoing project. Figures from some publications have not yet been curated, or are not available for display because of copyright restrictions.

EXPRESSION / LABELING:
Genes:
Fish:
Anatomical Terms:
Stage Range: Day 4 to Adult

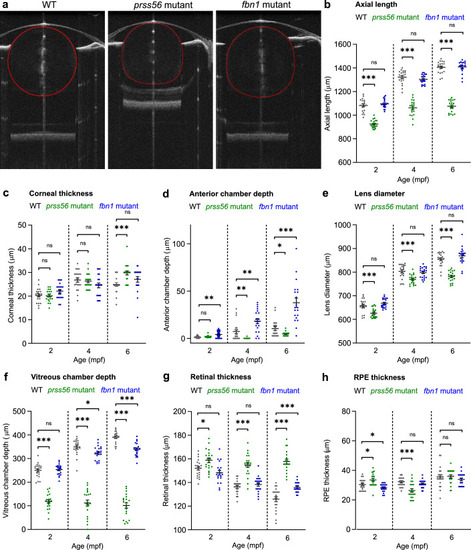
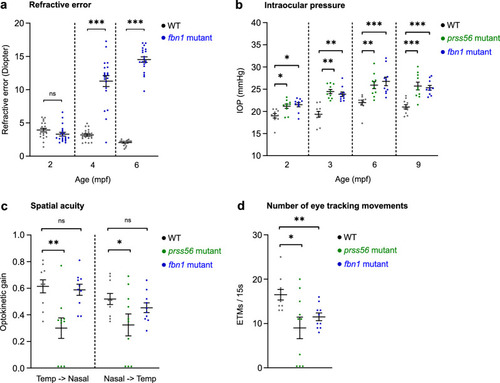
Human ophthalmic assays can be applied in zebrafish to measure ocular performance. Schematic overview of the pipeline of assays used to screen for ocular phenotypes in zebrafish. (a) SD-OCT to assess ocular biometry. (b) Eccentric photorefraction to measure refractive error. (c) Rebound tonometry to measure IOP. (d) The OKR to study visual capability. For full protocols see
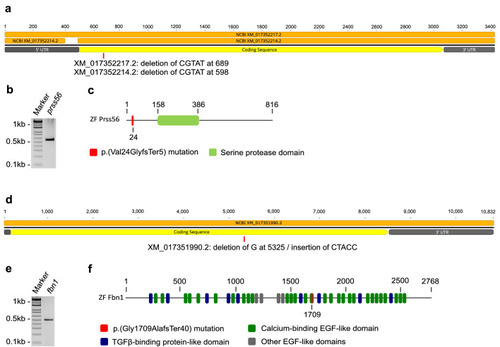
 Supplementary Materials.

Expression of prss56 and fbn1 and characteristics of the induced mutations. Schematic overview of predicted cDNA and protein structures and induced mutations in mutant zebrafish. (a) Schematic illustration of the cDNA structure of prss56. The two isoforms XM_017352214.2 and XM_017352217.2 are depicted in orange and the induced mutations are shown for each isoform at the approximate location. (b) Agarose gel loaded with reverse transcriptase polymerase chain reaction product (primer set 4) of isolated RNA extracted from 6 mpf zebrafish eyes, confirming ocular expression of prss56. See Supplementary Table S1 and Supplementary Fig. S3 for more information on primers. (c) Schematic illustration of the Prss56 protein structure and induced mutation (in red). (d) Schematic illustration of the cDNA structure of fbn1. (e) Agarose gel loaded with reverse transcriptase polymerase chain reaction product of isolated RNA extracted from 6 mpf zebrafish eyes, confirming ocular expression of fbn1. See Supplementary Table S1 for primers. (f) Schematic illustration of the Fbn1 protein structure and induced mutation (in red).

Loss of prss56 or fbn1 leads to distinctive biometrical changes in the eye. SD-OCT recordings of size-matched 2 to 6 mpf zebrafish biometrics of ocular compartments. Individual metrics of each compartment of the eye were corrected for the tissue-specific refractive index. (a) A single B-scan image of a typical 4 mpf zebrafish eye of respectively a WT, prss56 mutant, and fbn1 mutant. (b) Eyes of the prss56 mutants were significantly reduced in axial length compared with WT eyes at 2 mpf (effect size = −157 µm; P < 0.001), 4 mpf (effect size = −260 µm; P < .001), and 6 mpf (effect size = −330 µm; P < 0.001). The fbn1 mutant eyes showed no significant alteration relative to WT. (c) The corneal thickness of 6 mpf prss56 mutants was significantly increased (effect size = 5 µm; P < 0.001). No significant changes in corneal thickness were found in the fbn1 mutants. d The ACD in the prss56 mutants was significantly decreased at 4 mpf (Effect size = −7 µm; P < 0.01) and 6 mpf (Effect size = −6 µm; P < 0.05). The ACD was significantly increased in the fbn1 mutants at 2 mpf (effect size = 3 µm; P < 0.05), 4 mpf (effect size = 11 µm; P < 0.01), and 6 mpf (effect size = 27 µm; P < 0.001). (e) The lens diameter was significantly reduced in the prss56 mutants at 2 mpf (Effect size = −32 µm; P < 0.05), 4 mpf (effect size = −34 µm; P < 0.01), and 6 mpf (effect size = −73 µm; P < 0.001). The fbn1 mutant eyes showed no significant alteration in lens diameter relative to WT. f The VCD of the prss56 mutants was significantly reduced at 2 mpf (effect size = −132 µm; P < 0.001), 4 mpf (effect size = −237 µm; P < 0.001), and 6 mpf (effect size = −289 µm; P < 0.001). The fbn1 mutants showed a decrease in VCD at 6 mpf (effect size = −51 µm; P < 0.001). (g) The retinal thickness was larger in prss56 mutants at 2 mpf (effect size = 7 µm; P < 0.05), 4 mpf (effect size = 19 µm; P < 0.001), and 6 mpf (effect size = 32 µm; P < 0.001) and remained stable (range, 155–160 µm), whereas the WT retina is thinning over time (152 µm at 2 mpf; 137 µm at 4 mpf; 126 µm at 6 mpf). The retinal thickness was relatively increased in 6 mpf fbn1 mutants (effect size = 10 µm; P < 0.01). (h) The RPE thickness was significantly altered in 2 mpf (effect size = 3 µm; P < 0.05) and 4 mpf (effect size = −5 µm; P < 0.001) prss56 mutants while no significant differences were found in the fbn1 mutants. Sample size: n = 20 eyes for each genotype and time point. See Supplementary Table S2 for all statistics. Error bars: standard error of the mean. Significance: ns = not significant, *P  <  0.05, **P  <  0.01, ***P < 0.001. Scale bar, 100 µm. Mpf, months postfertilization; ACD, anterior chamber depth; VCD, vitreous chamber depth; RPE, retina pigmented epithelium.

Prss56 and fbn1 mutants show an altered refractive status, IOP, and visual capability. Measurements of refractive error, IOP, and the capability for spatial vision. (a) The loss of fbn1 resulted into a hyperopic shift of the refractive status at 4 mpf (effect size = +8D; P < 0.001) and 6 mpf (effect size = +12D; P < 0.001), relative to WT (n = 20 eyes per timepoint). (b) IOP measured by rebound tonometer (n = 10 eyes per timepoint). Prss56 and fbn1 mutants both showed significantly increased IOP values relative to WT at 2, 3, 6, and 9 mpf. (c, d) OKRs measured in 6 mpf prss56 and fbn1 mutants (n = 10 fish). An n = 3 prss56 mutants showed no detectable optokinetic nystagmus patterns. The visual capability (c) was indicated by the optokinetic gain, the ratio between eye velocity and stimulus velocity. The prss56 mutants showed a decrease in optokinetic gain for both temporal to nasal (left) and nasal to temporal (right) eye movements, relative to WT. The fbn1 showed no significant change in optokinetic gain. The number of ETMs/15 s (d) intervals was significantly decreased in both prss56 and fbn1 mutants. A baseline spatial frequency (0.15 cycles/degree) and drum velocity (20 degrees/second) were used. See Supplementary Table S2 for all statistics. Error bars: standard error of the mean. Significance: ns = not significant. *P  <  0.05, **P  <  0.01, ***P < 0.001.

PHENOTYPE:
Fish:
Observed In:
Stage: Adult
Acknowledgments
This image is the copyrighted work of the attributed author or publisher, and ZFIN has permission only to display this image to its users. Additional permissions should be obtained from the applicable author or publisher of the image. Full text @ Transl Vis Sci Technol