
Figure 7
- ID
- ZDB-FIG-220309-18
- Publication
- Banerjee et al., 2022 - Vision and sensorimotor defects associated with loss of Vps11 function in a zebrafish model of genetic leukoencephalopathy
- Other Figures
- All Figure Page
- Back to All Figure Page
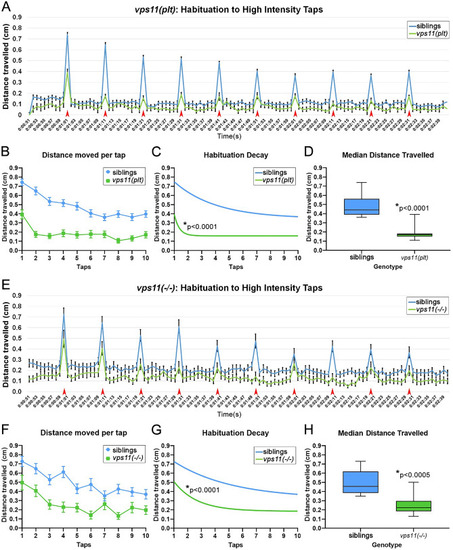
vps11(plt) and vps11(−/−) mutants at 7dpf show a significantly reduced habituation response to multiple high intensity acoustic/tap stimuli compared with their siblings. (A) Line graph representing distance travelled by larvae at 7dpf during the complete high intensity multiple tap paradigm comprising 10 high intensity taps (red arrows) with 10 s inter-stimulus intervals (sibling larvae in blue, vps11(plt) in green). (B) Graph representing average distance moved by sibling (blue; n = 68) and vps11(plt) (green; n = 64) larvae at each individual tap stimuli. (C) First order exponential decay curve representing average distance travelled by sibling (blue; n = 68) and vps11(plt) (green; n = 64) larvae at each individual tap stimuli *P < 0.0001. (D) Box-plots representing the average distance travelled by sibling (blue; n = 68) and vps11(plt) (green; n = 64) larvae at all 10 tap stimuli. *P < 0.0001. (E) Line graph representing distance travelled by larvae at 7dpf during the complete high intensity multiple tap paradigm comprising 10 high intensity taps (red arrows) with 10 s inter-stimulus intervals (sibling larvae in blue, vps11(−/−) in green). (F) Graph representing average distance moved by sibling (blue; n = 48) and vps11(−/−) (green; n = 44) larvae at each individual tap stimuli. (G) First order exponential decay curve representing average distance travelled by sibling (blue; n = 48) and vps11(−/−) (green; n = 44) larvae at each individual tap stimuli *P < 0.0001. H. Box-plots representing the average distance travelled by sibling (blue; n = 48) and vps11(−/−) (green; n = 44) larvae at all 10 tap stimuli *P < 0.0005. Error bars indicate SEM. |
| Fish: | |
|---|---|
| Condition: | |
| Observed In: | |
| Stage: | Days 7-13 |