
- Title
-
Vision and sensorimotor defects associated with loss of Vps11 function in a zebrafish model of genetic leukoencephalopathy
- Authors
- Banerjee, S., Ranspach, L.E., Luo, X., Cianciolo, L.T., Fogerty, J., Perkins, B.D., Thummel, R.
- Source
- Full text @ Sci. Rep.

ZFIN is incorporating published figure images and captions as part of an ongoing project. Figures from some publications have not yet been curated, or are not available for display because of copyright restrictions. |
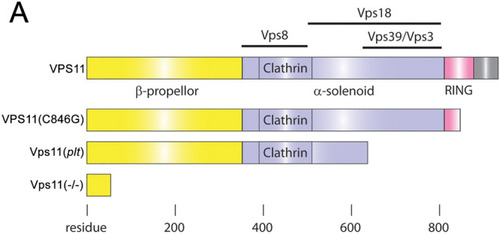
Schematic representation comparing the lengths and interaction domains of human VPS11 and VPS11(C846G) with zebrafish Vps11(plt) and Vps11(−/−). ( |
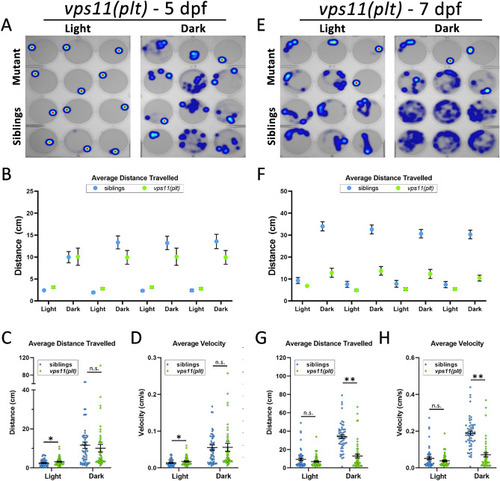
vps11(plt) mutants show normal distance travelled and velocity at 5dpf and significantly reduced distance travelled and velocity at 7dpf during alternating cycles of light and dark. (A) Representative heat maps of total distance moved by individual larvae at 5dpf (vps11(plt) mutants = top two rows; siblings = bottom two rows) during a 3-min period of light and dark. (B) Graph representing average distance travelled in 4 alternating light–dark cycles of 3 min each (sibling larvae in blue; vps11(plt) mutants in green). (C) Graph representing average distance travelled in light and dark periods. (D) Graph representing average velocity of sibling larvae and vps11(plt) in light and dark periods. n = 60 sibling and 60 vps11(plt) larvae at 5 dpf. (E) Representative heat maps displaying total distance moved by individual larvae at 7dpf (vps11(plt) mutants = top two rows; siblings = bottom two rows) during a 3-min period of light and dark. (F) Graph representing average distance travelled by larvae in 4 alternating light–dark cycles of 3 min each (sibling larvae in blue; vps11(plt) mutants in green). (G) Graph representing average distance travelled in light and dark periods. (H) Graph representing average velocity of sibling larvae and vps11(plt) in light and dark periods. n = 54 sibling and 52 vps11(plt) larvae. *P < 0.05, **P < 0.01. Error bars indicate SEM. |
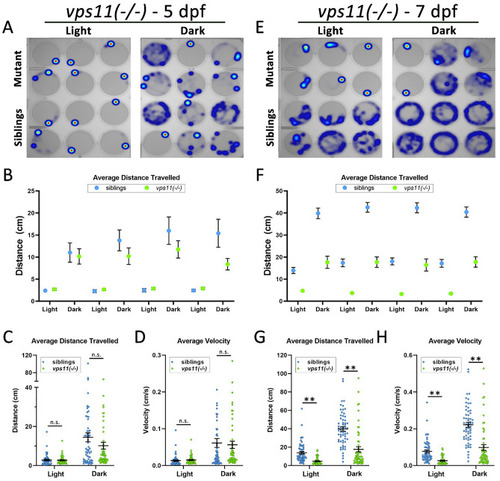
vps11(−/−) mutants show normal distance travelled and velocity at 5dpf and significantly reduced distance travelled and velocity at 7dpf during alternating cycles of light and dark. (A) Representative heat maps of total distance moved by individual vps11(−/−) larvae at 5dpf (mutants = top two rows; siblings = bottom two rows) during a 3-min period of light and dark. (B) Graph representing average distance travelled in 4 alternating light–dark cycles of 3 min each (sibling larvae in blue; mutants in green). (C) Graph representing average distance travelled in light and dark periods. (D) Graph representing average velocity of sibling and vps11(−/−) larvae in light and dark periods. n = 60 siblings and 58 vps11(−/−) larvae. (E) Representative heat maps generated of total distance moved by individual vps11(−/−) larvae at 7dpf (mutants = top two rows; siblings = bottom two rows) in a 3-min period of light and dark. (F) Graph representing average distance travelled in 4 alternating light–dark cycles of 3 min each (sibling larvae in blue; vps11(−/−) mutants in green). (G) Graph representing average distance travelled in light and dark periods. (H) Graph representing average velocity of sibling and vps11(−/−) larvae in light and dark periods. n = 60 siblings and 57 vps11(−/−) larvae. **P < 0.01. Error bars indicate SEM. |
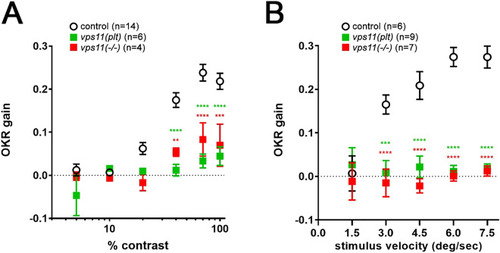
Visual function is compromised in vps11(plt) and vps11(−/−) mutants. Optokinetic response of larval vps11(plt) and vps11(−/−) homozygotes compared with sibling controls as a function of (A) contrast and (B) stimulus velocity. Asterisks indicate significant differences from controls (2-way ANOVA with Sidak’s multiple comparison test) **P < 0.01, ***P < 0.001, ****P < 0.0001. PHENOTYPE:
|
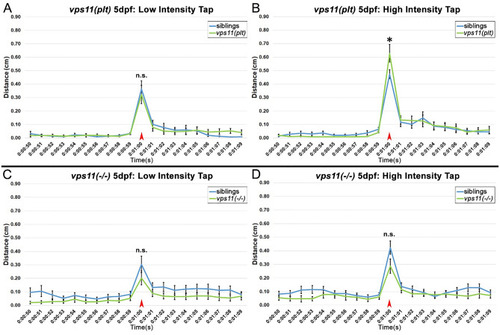
vps11(plt) and vps11(−/−) mutants at 5dpf show normal distance travelled in response to both low and high intensity acoustic/tap stimuli. (A–D) Line graphs representing distance travelled by larvae at 5dpf before and after an acoustic/tap stimulus (red arrow). (A) Response of vps11(plt) (green; n = 55) and sibling larvae (blue; n = 61) to a low intensity stimulus. (B) Response of vps11(plt) (green; n = 63) and sibling larvae (blue; n = 67) to a high intensity stimulus. (C) Response of vps11(−/−) (green; n = 59) and sibling larvae (blue; n = 60) to a low intensity stimulus. (D) Response of vps11(−/−) (green; n = 57) and sibling larvae (blue; n = 60) to a high intensity stimulus. Error bars indicate SEM. PHENOTYPE:
|
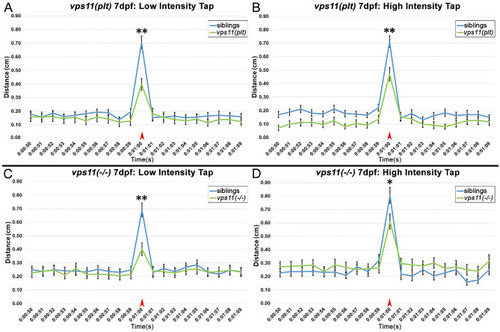
vps11(plt) and vps11(−/−) mutants at 7dpf show significantly reduced distance travelled in response to both low and high intensity acoustic/tap stimuli. (A–D) Line graphs representing distance travelled by larvae at 7dpf before and after an acoustic/tap stimulus (red arrow). (A) Response of vps11(plt) (green; n = 69) and sibling larvae (blue; n = 77) to a low intensity stimulus. (B) Response of vps11(plt) (green; n = 71) and sibling larvae (blue; n = 73) to a high intensity stimulus. (C) Response of vps11(−/−) (green; n = 54) and sibling larvae (blue; n = 54) to a low intensity stimulus. (D) Response of vps11(−/−) (green; n = 48) and sibling larvae (blue; n = 47) to a high intensity stimulus. *P < 0.05 **P < 0.01. Error bars indicate SEM. PHENOTYPE:
|
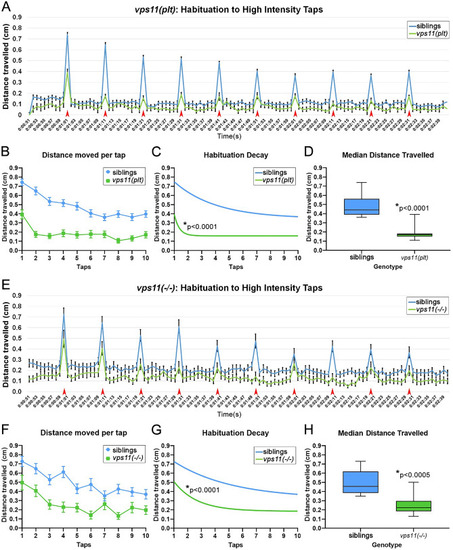
vps11(plt) and vps11(−/−) mutants at 7dpf show a significantly reduced habituation response to multiple high intensity acoustic/tap stimuli compared with their siblings. (A) Line graph representing distance travelled by larvae at 7dpf during the complete high intensity multiple tap paradigm comprising 10 high intensity taps (red arrows) with 10 s inter-stimulus intervals (sibling larvae in blue, vps11(plt) in green). (B) Graph representing average distance moved by sibling (blue; n = 68) and vps11(plt) (green; n = 64) larvae at each individual tap stimuli. (C) First order exponential decay curve representing average distance travelled by sibling (blue; n = 68) and vps11(plt) (green; n = 64) larvae at each individual tap stimuli *P < 0.0001. (D) Box-plots representing the average distance travelled by sibling (blue; n = 68) and vps11(plt) (green; n = 64) larvae at all 10 tap stimuli. *P < 0.0001. (E) Line graph representing distance travelled by larvae at 7dpf during the complete high intensity multiple tap paradigm comprising 10 high intensity taps (red arrows) with 10 s inter-stimulus intervals (sibling larvae in blue, vps11(−/−) in green). (F) Graph representing average distance moved by sibling (blue; n = 48) and vps11(−/−) (green; n = 44) larvae at each individual tap stimuli. (G) First order exponential decay curve representing average distance travelled by sibling (blue; n = 48) and vps11(−/−) (green; n = 44) larvae at each individual tap stimuli *P < 0.0001. H. Box-plots representing the average distance travelled by sibling (blue; n = 48) and vps11(−/−) (green; n = 44) larvae at all 10 tap stimuli *P < 0.0005. Error bars indicate SEM. PHENOTYPE:
|
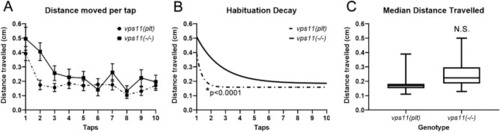
vps11(plt) and vps11(−/−) mutants show different rates of habituation response to multiple high intensity acoustic/tap stimuli. (A) Graph representing average distance moved by vps11(plt) (dashed line; n = 64) and vps11(−/−) (solid line; n = 44) larvae at each individual tap stimuli. B. First order exponential decay curve representing average distance travelled by vps11(plt) (dashed line; n = 64) and vps11(−/−) (solid line; n = 44) larvae at each individual tap stimuli *P < 0.0001. (C) Box-plots representing the average distance travelled by vps11(plt) (n = 64) and vps11(−/−) (n = 44) larvae at all 10 tap stimuli. Error bars indicate SEM. PHENOTYPE:
|