
FIGURE 2
- ID
- ZDB-FIG-220303-2
- Publication
- Martin et al., 2022 - Single-Cell RNA Sequencing Characterizes the Molecular Heterogeneity of the Larval Zebrafish Optic Tectum
- Other Figures
- All Figure Page
- Back to All Figure Page
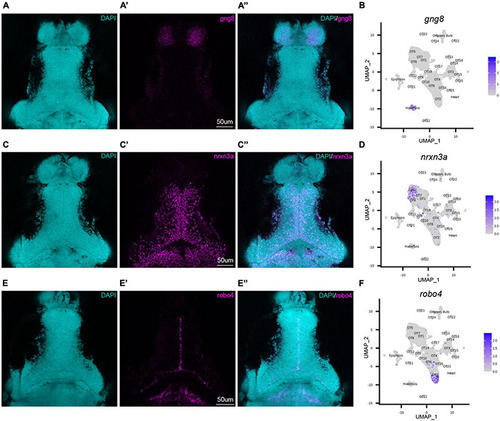
HCR RNA-FISH validates bioinformatic findings and spatially locates tectal populations. Hybridization chain reaction RNA-fluorescence in situ hybridization (HCR RNA-FISH) was performed using proprietary custom probe sets designed by Molecular Instruments to spatially map populations and validate bioinformatic exclusion of non-interest cells. (A–A”,C–C”,E–E”) Single z-slices of representative images showing expression of habenula (gng8) and OT (nrxn3a, robo4) markers in 7 dpf larval zebrafish. (A–A”) gng8+ cells are located in the habenula, validating gng8 expression as a method for annotating habenular cells and spatially mapping 89% of habenula cells (Supplementary Table 2). (B) Feature plot showing gng8 expression is restricted to the annotated habenula cluster. (C–C”) nrxn3a+ cells are primarily located medially within the periventricular layer, and spatially map 54% of OT5 (Supplementary Table 2). (D) Feature plot showing expression of nrxn3a is enriched in OT5 and to a lesser extent, OT8. (E–E”) robo4+ OT cells are located near the intratectal commissure, likely within the tectal proliferation zone, and spatially map 51% of OT2 cells (Supplementary Table 2). (F) Feature plot showing robo4 expression is restricted to OT2. All HCR RNA-FISH panels include DAPI staining as a cellular reference. |
| Genes: | |
|---|---|
| Fish: | |
| Anatomical Terms: | |
| Stage: | Days 7-13 |