
FIGURE 1
- ID
- ZDB-FIG-220303-1
- Publication
- Martin et al., 2022 - Single-Cell RNA Sequencing Characterizes the Molecular Heterogeneity of the Larval Zebrafish Optic Tectum
- Other Figures
- All Figure Page
- Back to All Figure Page
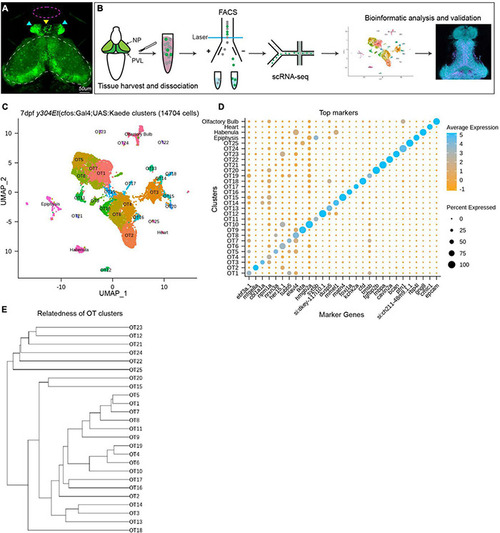
Analysis of scRNA-seq data reveals 25 distinct populations within the larval zebrafish optic tectum. (A) 7 dpf representative image of the y304Et(cfos:Gal4;UAS:Kaede) enhancer trap line used to obtain tectal cells. Optic tectum (white dashes), habenula (cyan arrows), epiphysis (yellow arrow), and olfactory system (magenta dashes) are indicated. The heart is not shown. (B) Experimental workflow for the collection and isolation of tectal cells. Heads from 7 dpf Kaede+ larvae were collected and enzymatically dissociated, followed by FACS to isolate fluorescent cells. After quality control, 14,704 single-cell libraries obtained by the 10X Genomics Chromium platform were used for downstream analysis. PCA and graph-based clustering were utilized to sort cells into clusters and identify candidate marker genes. Bioinformatic validation and spatial mapping was completed via fluorescent HCR RNA-FISH. (C) Uniform manifold approximation and projection (UMAP) showing cell populations identified via scRNA-seq analysis of 14,704 Kaede+ cells. Each point represents a single cell colored according to cluster identity as determined by unbiased graph-based clustering using the Louvain algorithm with multilevel refinement. UMAP embedding was used for visualization purposes only and not to define the clusters. The resulting two-dimensional spatial arrangement of clusters is a product of genetic similarity, as similar clusters are represented as closer together. (D) Candidate marker genes (columns) for each cluster (rows) were nominated by differential expression analysis wherein candidate genes must: (1) be expressed in at least 50% of cells within that cluster, and (2) show specificity to the cluster compared to all other cells by exhibiting ≥ 1 log2 fold-change in expression with at least 25% difference in gene presence. (E) Phylogram showing cluster relatedness based upon variable features defined by SCTransform and calculated within PCA space. |