
Figure 1
- ID
- ZDB-FIG-220302-87
- Publication
- Tang et al., 2022 - Zebrafish Model-Based Assessment of Indoxyl Sulfate-Induced Oxidative Stress and Its Impact on Renal and Cardiac Development
- Other Figures
- All Figure Page
- Back to All Figure Page
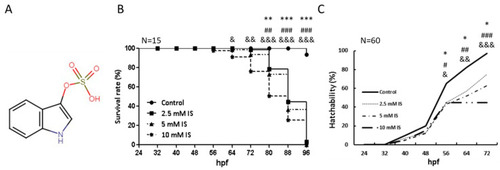
Toxicity profile of IS as indicated by the survival and hatchability of zebrafish embryos (A) Structure of IS. (B) Time-course plot of embryo survival in the control group vs. the IS group at 96 h. (C) Hatchability of zebrafish after IS treatment. hpf: hours postfertilization. (B,C) were statistically analyzed using Fisher’s exact test. * p < 0.05, ** p < 0.001 and *** p < 0.0001, the 2.5 mM IS group compared with the control group. # p < 0.05, ## p < 0.001 and ### p < 0.0001, the 5 mM IS group compared with the control group. & p < 0.05, && p < 0.001 and &&& p < 0.0001, the 10 mM IS group compared with the control group. N indicates the embryo number for each group. |