
Figure 1
- ID
- ZDB-FIG-220302-195
- Publication
- Trengove et al., 2022 - Functional Analysis of Zebrafish socs4a: Impacts on the Notochord and Sensory Function
- Other Figures
- All Figure Page
- Back to All Figure Page
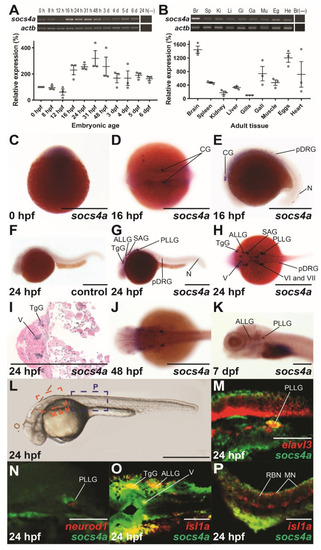
Spatio-temporal expression profile of socs4a. RT-PCR analysis of socs4a and control actb (β-actin) from total RNA extracted from embryos at the indicated times post fertilization ((A), upper panel) or from the indicated adult tissues ((B), upper panel), with a no RT control included (−). Levels of socs4a were quantified using densitometry and standardized to the actb gene with the embryonic expression profile shown relative to expression at 0 hpf ((A), lower panel) and the adult profile relative to expression in the gills ((B), lower panel). Whole-mount in situ hybridization analysis of socs4a on embryos at 0 hpf (C), 16 hpf (D,E), 24 hpf (F–I), 48 hpf (J), and 7 dpf (K) using either sense (control) or anti-sense (socs4a) probes, as indicated. Expression is demonstrated by the presence of blue/purple staining. dFISH on 24 hpf embryos with anti-sense probes for socs4a and either elavl3 (M), neurod1 (N) or isl1a (O,P), with the regions of the embryo imaged displayed in panel L. Expression is demonstrated by red or green fluorescence for each marker, as indicated, with areas of co-expression being yellow. The embryo in panel C is upright and imaged laterally. All other embryos are positioned with their anterior to the left and imaged laterally (E–G,K–N,P), dorsally (D,H,J,O) or represent a cross-section (I). Scale bars = 0.5 mm (C–L) or 0.1 mm (M–P). Abbreviations: ALLG, anterior lateral line ganglion; Br, brain; CG, cranial ganglion; Eg, eggs; Ga, gall bladder; Gi, gills; He, heart; Ki, kidney; Li, liver; MN, motor neuron; Mu, muscle; N, neuron; pDRG, precursor dorsal root ganglion; PLLG, posterior lateral line ganglion; RBN, Rohan–Beard neuron; SAG, statoacoustic ganglion; Sp, spleen; TgG, trigeminal ganglion; V, fifth cranial nerve; VI, sixth cranial nerve; VII, seventh cranial nerve. |