
Figure 2
- ID
- ZDB-FIG-220219-111
- Publication
- Sanchez-Gonzalez et al., 2022 - Innate Immune Pathways Promote Oligodendrocyte Progenitor Cell Recruitment to the Injury Site in Adult Zebrafish Brain
- Other Figures
- All Figure Page
- Back to All Figure Page
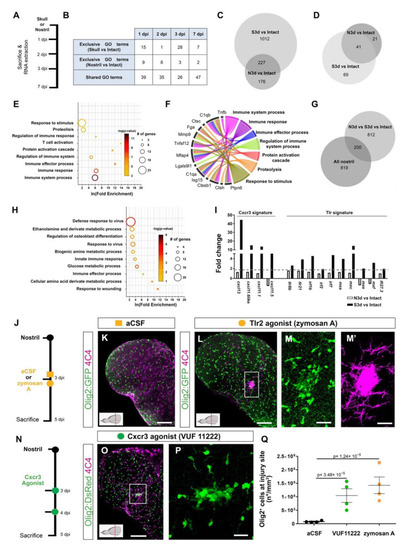
Activation of innate immunity pathways after injury induced a prolonged glial reaction in the zebrafish telencephalon. (A) Experimental design to analyze transcriptome changes occurring upon nostril and skull injury. (B) Table depicting the number of significantly regulated Gene Ontology terms (Injury vs. Intact) at different time points after nostril and skull injury. (C) Comparative analysis using a Venn diagram illustrating the number of genes exclusively regulated 3 days after skull injury (Skull vs. Intact) and not after nostril 3 dpi (Nostril vs. Intact). (D) Venn diagram depicting the overlap between ECM-related genes regulated at 3 days after skull and nostril injury. Regulated genes were defined by a p-value < 0.05, fold-change > 1.6, and a linear average expression > 20. (E) Significantly enriched Gene Ontology (GO) terms of biological processes (color indicates p-values and symbol size number of identified genes within the term) in an ECM-related gene set regulated exclusively 3 days after skull injury (69 genes in panel (D)). (F) Chord diagram depicting selection of regulated ECM-related genes and associated GO terms biological processes. (G) Venn diagram depicting the overlap between genes exclusively regulated at 3 days after skull injury and genes regulated after the nostril injury at any time point. Note that 80% of the genes were exclusively regulated after skull injury at 3 dpi but were never regulated after nostril injury. (H) Plot showing significantly enriched (p-values indicated on bars) GO terms related to biological processes in a gene set regulated exclusively 3 days after skull injury (Skull 3 dpi vs. Nostril at any time point), correlating with glial accumulation. (I) Histogram depicting the regulation of genes related to Cxcr3 and Tlr signatures after nostril and skull injury. The dotted, gray line shows the 1.6-fold change cut off. (J) Scheme of the experimental design analyzing the ability of the Tlr2 agonist to induce glia accumulation after nostril injury. (K,L) Images of 5-day-injured telencephalic sections in the Tg(Olig2:GFP) line after nostril injury and aCSF (K) or zymosan A injections (L). (M,M′) Magnifications of the boxed area in L depict the exacerbated accumulation of Olig2:GFP+ (M) and 4C4+ (M′) cells at the injury site. (N) Scheme representing the experimental design to analyze the capacity of the Cxcr3 agonist (VUF 11222) to induce a reactive gliosis. (O) Micrograph illustrating the reactivity of Olig2:DsRed+ and 4C4+ cells after Cxcr3 activation. (P) Magnification of the injured area in (O). (Q) Graph showing the density of Olig2:GFP+ cells in the injured area 5 days after nostril injury with aCSF, Cxcr3 or Tlr2 agonist treatments. Data are shown as mean ± SEM; each data point represents one animal. p-values are based on a one-way ANOVA (p-value = 1.183 × 10⁻⁵) with a post-hoc Dunnett test (Many-to-One). All images are full z-projections of a confocal stack. Insets indicate the rostro-caudal levels of the sections. Scale bars in (K,L,O) = 100 µm; scale bars in (M,M′,P) = 20 µm; Abbreviations: dpi: days post-injury, N3d: nostril 3 dpi, S3d: skull 3 dpi; Ctrl: control; aCSF: artificial cerebrospinal fluid. Symbol description: orange square: ventricular injection of aCSF; orange circle: ventricular injection of zymosan A, Tlr2 agonist; green circle: VUF 11222, Cxcr3 agonist; black circle: nostril injury. |