
- Title
-
Innate Immune Pathways Promote Oligodendrocyte Progenitor Cell Recruitment to the Injury Site in Adult Zebrafish Brain
- Authors
- Sanchez-Gonzalez, R., Koupourtidou, C., Lepko, T., Zambusi, A., Novoselc, K.T., Durovic, T., Aschenbroich, S., Schwarz, V., Breunig, C.T., Straka, H., Huttner, H.B., Irmler, M., Beckers, J., Wurst, W., Zwergal, A., Schauer, T., Straub, T., Czopka, T., Trümbach, D., Götz, M., Stricker, S.H., Ninkovic, J.
- Source
- Full text @ Cells
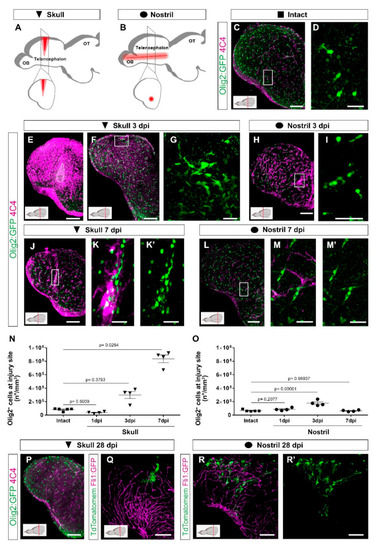
Distinct injury paradigms in the zebrafish telencephalon led to either scarless regeneration or prolonged glial reactivity. (A,B) Schemes depicting skull (A) and nostril (B) injury paradigms. Red triangle (A) and red line (B) illustrate the injury track. (C,D) Micrographs of a telencephalic section showing the distribution of Olig2:GFP+ oligodendroglia and 4C4+ microglia/monocytes in the intact brain. (E,F) Images of 3 dpi skull-injured sections (4C4+ and Olig2:GFP+ cells) at the level of the injury core delineated by a white line (E) and lateral to the injury core depicting the first signs of Olig2:GFP+ cells to accumulation indicated by the boxed area (F). (H) Image showing the distribution of Olig2:GFP+ and 4C4+ cells at 3 dpi after a nostril injury. (G,I) are magnifications of the boxed areas in (F) and (H), depicting Olig2:GFP+ cell distribution. (J–M′) Images showing the reactivity of 4C4+ and Olig2:GFP+ cells at 7 days after skull (J) and nostril (L) injury. (K,K′,M,M′) are magnifications of the boxed area in the respective images. (N,O) Graphs depicting the density of Olig2:GFP+ cells at the injury site after skull (N) and nostril (O) injury. Data are shown as mean ± SEM; each data point represents one animal. Statistical analysis is based on a non-parametric Kruskal–Wallis Test (p-value = 0.0021) with a post-hoc Dunn test (Many-to-One) in N and a one-way ANOVA (p-value = 2.483 × 10⁻⁵) with a post-hoc Dunnett test (many-to-one) in (O). (P) The accumulation of 4C4+ and Olig2:GFP+ cells resolved at 28 days after skull injury. (Q–R′) Images showing the morphology of ependymoglial cells (labelled by electroporation of TdTomatomem) 28 days after skull (Q) and nostril injury (R,R′). While we observed the restoration of the radial morphology of the labelled ependymoglia that contacts the basement membrane after nostril injury (similar to the intact brain), the ependymoglia after skull injury failed to restore radial morphology and built extensive contacts with Fli1-positive blood vessels. All images are full z-projections of a confocal stack; insets indicate the rostro-caudal levels of the sections. Scale bars in (C,E,F,H,J,L,P,Q,R,R′) = 100 µm; Scale bars in (D,G,I,K,K′,M,M′) = 20 µm. Abbreviations: OB: olfactory bulb, OT: optic tectum, dpi: days post-injury; AFOG: acid fuchsin orange G. Symbol description: black triangle: skull injury; black circle: nostril injury. |
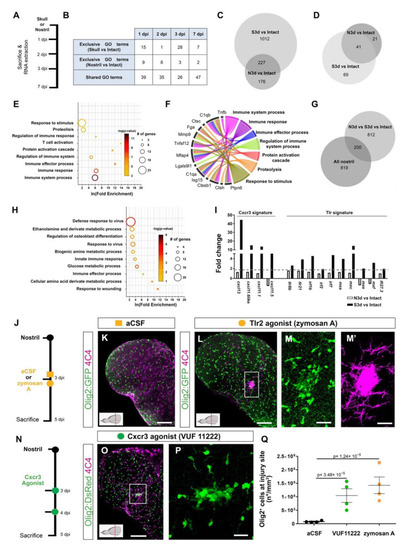
Activation of innate immunity pathways after injury induced a prolonged glial reaction in the zebrafish telencephalon. (A) Experimental design to analyze transcriptome changes occurring upon nostril and skull injury. (B) Table depicting the number of significantly regulated Gene Ontology terms (Injury vs. Intact) at different time points after nostril and skull injury. (C) Comparative analysis using a Venn diagram illustrating the number of genes exclusively regulated 3 days after skull injury (Skull vs. Intact) and not after nostril 3 dpi (Nostril vs. Intact). (D) Venn diagram depicting the overlap between ECM-related genes regulated at 3 days after skull and nostril injury. Regulated genes were defined by a p-value < 0.05, fold-change > 1.6, and a linear average expression > 20. (E) Significantly enriched Gene Ontology (GO) terms of biological processes (color indicates p-values and symbol size number of identified genes within the term) in an ECM-related gene set regulated exclusively 3 days after skull injury (69 genes in panel (D)). (F) Chord diagram depicting selection of regulated ECM-related genes and associated GO terms biological processes. (G) Venn diagram depicting the overlap between genes exclusively regulated at 3 days after skull injury and genes regulated after the nostril injury at any time point. Note that 80% of the genes were exclusively regulated after skull injury at 3 dpi but were never regulated after nostril injury. (H) Plot showing significantly enriched (p-values indicated on bars) GO terms related to biological processes in a gene set regulated exclusively 3 days after skull injury (Skull 3 dpi vs. Nostril at any time point), correlating with glial accumulation. (I) Histogram depicting the regulation of genes related to Cxcr3 and Tlr signatures after nostril and skull injury. The dotted, gray line shows the 1.6-fold change cut off. (J) Scheme of the experimental design analyzing the ability of the Tlr2 agonist to induce glia accumulation after nostril injury. (K,L) Images of 5-day-injured telencephalic sections in the Tg(Olig2:GFP) line after nostril injury and aCSF (K) or zymosan A injections (L). (M,M′) Magnifications of the boxed area in L depict the exacerbated accumulation of Olig2:GFP+ (M) and 4C4+ (M′) cells at the injury site. (N) Scheme representing the experimental design to analyze the capacity of the Cxcr3 agonist (VUF 11222) to induce a reactive gliosis. (O) Micrograph illustrating the reactivity of Olig2:DsRed+ and 4C4+ cells after Cxcr3 activation. (P) Magnification of the injured area in (O). (Q) Graph showing the density of Olig2:GFP+ cells in the injured area 5 days after nostril injury with aCSF, Cxcr3 or Tlr2 agonist treatments. Data are shown as mean ± SEM; each data point represents one animal. p-values are based on a one-way ANOVA (p-value = 1.183 × 10⁻⁵) with a post-hoc Dunnett test (Many-to-One). All images are full z-projections of a confocal stack. Insets indicate the rostro-caudal levels of the sections. Scale bars in (K,L,O) = 100 µm; scale bars in (M,M′,P) = 20 µm; Abbreviations: dpi: days post-injury, N3d: nostril 3 dpi, S3d: skull 3 dpi; Ctrl: control; aCSF: artificial cerebrospinal fluid. Symbol description: orange square: ventricular injection of aCSF; orange circle: ventricular injection of zymosan A, Tlr2 agonist; green circle: VUF 11222, Cxcr3 agonist; black circle: nostril injury. |
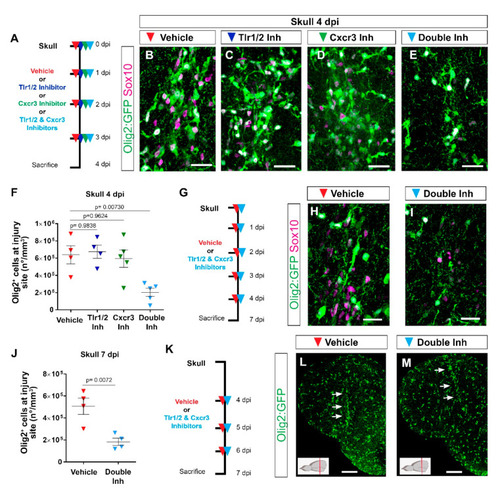
Tlr1/2 and Cxcr3 pathways redundantly control the accumulation of Olig2:GFP+ cells but not their maintenance at the injury site in the zebrafish telencephalon. (A) Scheme of the experimental setup to address the role of Cxcr3 and Tlr1/2 in the reactive gliosis 4 days after injury. (B–E) Micrographs of telencephalic sections obtained after 4 dpi depicting Olig2:GFP+ and Sox10+ oligodendroglia reactivity with vehicle (B), Tlr1/2 inhibitor (C), Cxcr3 inhibitor (D), and double-inhibitor (E) treatments. (F) Graph showing the density of Olig2:GFP+ cells located at the injury site after vehicle, Tlr1/2 inhibitor (CU CPT22), Cxcr3 inhibitor (NBI 74330) and double-inhibitor combination (NBI 74330 + CU CPT22) treatment. Note that only the double-inhibitor cocktail reduces the number of Olig2:GFP+ cells accumulating at the injury site. Data shown as mean ± SEM; each data point represents one animal. p-values are based on a one-way ANOVA (p-value = 4.074 × 10⁻³) with a post-hoc Dunnett test (Many-to-One). (G) Experimental outline to assess the effect of vehicle and double-inhibitor treatment 7 dpi. (H,I) Micrographs of telencephalic sections 7 days after skull injury depicting Olig2:GFP+ and Sox10+ oligodendroglia after vehicle (H) and inhibitor cocktail (NBI 74330 and CU CPT22) (I) treatment. (J) Graph illustrating the density of Olig2:GFP+ cells located within the injured volume after vehicle and double-inhibitor treatment. An equal volume was quantified in both conditions (p-values is based on Student’s t-test with equal variances). (K) Scheme depicting the experimental design to assess the capacity of the vehicle and double inhibitors treatment to resolve glial accumulation. (L,M) Micrographs showing telencephalic sections 7 days after skull injury and vehicle (L) or double-inhibitor (M) treatment. White arrows indicate the injury site. Note that both vehicle and inhibitor treatments failed to resolve Olig2:GFP+ accumulation. All images are full z-projections of confocal stack. The level of the cross-section is indicated in the inset. Scale bars in (L,M) = 100 µm; scale bars in (B–E,H,I) = 20 µm. Abbreviations: dpi: days post-injury, Inh: inhibitor. Symbol description: red triangle: vehicle; dark blue triangle: Tlr1/2 inhibitor, CU CPT22; green triangle: Cxcr3 inhibitor, NBI 74330; light blue triangle: double inhibitors, NBI 74330 and CU CPT22. |
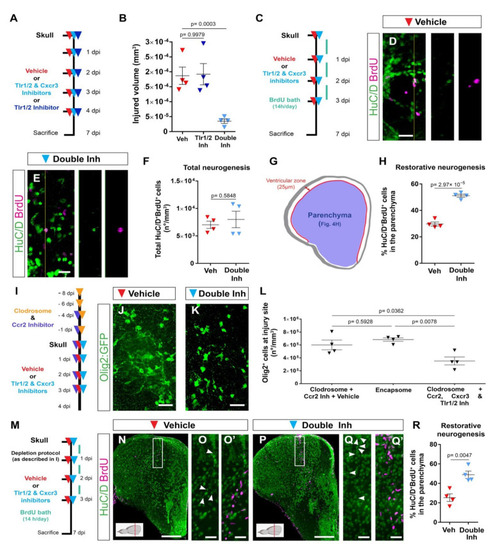
Activation of Tlr1/2 and Cxcr3 creates a detrimental environment by inducing oligodendroglia accumulation in a microglia/monocyte-independent manner. (A) Scheme of the experimental design to analyze the consequences of double-inhibitor treatment (NBI 74330 and CU CPT22). (B) Graph illustrating the size of the injured volume 7 days after skull injury and vehicle, Tlr1/2 inhibitor (CU CPT22), or double Tlr1/2 and Cxcr3 inhibitor (NBI 74330 and CU CPT22) treatment. p-values are based on a one-way ANOVA (p-value = 1.971 × 10⁻⁴) with a post-hoc Dunnett test (Many-to-One). (C) Experimental scheme designed to study restorative neurogenesis upon different treatments. (D,E) Images depicting HuC/D+ and BrdU+ cells located in the parenchyma following vehicle (D) and double-inhibitor (E) treatment. (F) Dot-plot showing the total density (whole telencephalon) of HuC/D+ and BrdU+ after vehicle and Tlr1/2 and Cxcr3 inhibitor treatment. p-value is based on WelcH′s t-test with unequal variances. (G) Diagram illustrating the ventricular zone (25 µm from the ventricle surface) and the parenchyma (blue area) in the telencephalic region. Restorative neurogenesis was measured by the proportion of newly generated neurons (HuC/D+ and BrdU+) that migrated towards the parenchyma with respect to the total number (ventricular zone and parenchyma) of new neurons. (H) Graph depicting the proportion of HuC/D+ and BrdU+ cells located in the telencephalic parenchyma after vehicle and Tlr1/2 and Cxcr3 inhibitor treatment. p-value is based on Student’s t-test with equal variances. (I) Design of the experimental workflow to analyze the effect of Tlr1/2 and Cxcr3 inhibitors on accumulation of Olig2:GFP+ cells after microglia/monocytes depletion. (J,K) Micrographs depicting the reactivity of Olig2:GFP+ cells after skull injury at 4 dpi with microglia/monocyte depletion and vehicle (J) or Tlr1/2 and Cxcr3 inhibitor treatments (K). (L) Graph illustrating the density of Olig2:GFP+ cells at the injury site at 4 dpi following Clodrosome + Ccr2 (MK-0812) inhibitor treatment (microglia/monocyte depletion protocol), Encapsome (empty liposomes, control for Clodrosome; ventricular injection) and Clodrosome + Ccr2 + Tlr1/2 (CU CPT22) + Cxcr3 (NBI 74330) inhibitor treatments. The decrease in Olig2:GFP+ cell accumulation after Tlr1/2 and Cxcr3 inhibitor treatment was maintained in microglia/monocyte-depleted brain. p-values are based on a one-way ANOVA (p-value = 7.957 × 10⁻³) with a post-hoc Tukey Test (All Pairs). (M) Design of the experimental protocol used to analyze injury-induced neurogenesis (BrdU-based birth dating) in microglia/monocyte-depleted brains treated with vehicle or Tlr1/2 and Cxcr3 inhibitor cocktail. (N,P) Micrographs of injured telencephala at 7 dpi showing the generation of new neurons (HuC/D+/BrdU+) after vehicle (N) and Tlr1/2 and Cxcr3 inhibitor (P) treatment in microglia/monocyte-depleted brains. (O,O′,Q,Q′) are magnifications of the areas boxed in (N,P), respectively. White arrowheads depict double HuC/D+ and BrdU+ cells. The level of the cross-section is indicated in the inset. (R) Graph depicting the proportion of HuC/D+ and BrdU+ cells located in the telencephalic parenchyma after vehicle and Tlr1/2 and Cxcr3 inhibitor treatment. p-value is based on Student’s t-test with equal variances. All images are full z-projections of a confocal stack. Data are shown as mean ± SEM; each data point represents one animal. Scale bars in (N,P) = 100 μm; scale bars in (D,E,J,K,O,O′,Q,Q′) = 20 μm. Abbreviations: dpi: days post-injury; Veh: vehicle; Inh: inhibitors. Symbol description: red triangle: vehicle; dark blue triangle: Tlr1/2 inhibitor, CU CPT22; light blue triangle: double inhibitors, NBI 74330 and CU CPT22; orange triangle: ventricular Clodrosome injection; purple triangle: intraperitoneal Ccr2 inhibitor injection, MK-0812. |
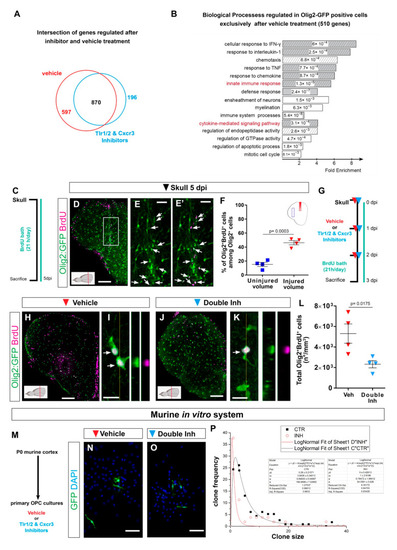
Transcriptome analysis of zebrafish oligodendrocyte lineage reveals the activation of innate immunity and cell cycle pathways after skull injury. (A) Venn diagram of genes regulated at 3 dpi in Olig2-GFP+ cells after vehicle (red) and Tlr1/2 and Cxcr3 inhibitor (cyan) treatment. (B) Histogram depicting GO biological process terms significantly enriched (p-values indicated on bars) in a gene set (597 genes in (A)) normalized after inhibitor treatment and therefore regulated exclusively after vehicle treatment. GO terms related to inflammatory response are shown by gray bars; patterned bars indicate processes previously reported to be activated in response to injury. Note that both innate immunity and cytokine-mediated signaling pathways are normalized upon inhibitor treatment. (C) Scheme depicting the experimental design to analyze the proliferative capacity of Olig2:GFP+ cells during the first 5 days after skull injury. (D) Micrograph of injured section 5 days after skull injury stained for GFP and BrdU. (E,E′) Magnification of the oligodendroglial accumulation boxed in (D). Double Olig2:GFP+ and BrdU+ cells are marked with white arrows. (F) Graph illustrating the proportion of Olig2:GFP+ and BrdU+ cells located at the injury site and in an equivalent uninjured volume in the same section. Note that 45% of the Olig2:GFP+ cells at the injury site proliferated after skull injury. (G) Scheme of the experimental design to assess the proliferation of Olig2-GFP+ cells after vehicle and inhibitors treatment. (H,J) Images of telencephalic sections 3 days after skull injury and BrdU bath with vehicle (H) and double inhibitors (J) treatments. (I,K) Micrographs with orthogonal projections of proliferating (BrdU+) Olig2:GFP+ cells after vehicle (I) and Tlr1/2 and Cxcr3 inhibitor (K) treatment. (L) Graph depicting the density of Olig2:GFP+ and BrdU+ cells 3 dpi in vehicle and Tlr1/2 and Cxcr3 inhibitor treated animals. (M) Experimental design to measure the clonal growth of murine OPCs primary cultures after vehicle and Tlr1/2 and Cxcr3 inhibitor cocktail treatment. OPCs were permanently labeled with GFP expressing retrovirus. (N,O) Micrographs depicting OPC derived clones 5 days after retroviral infection in vehicle (N) and Tlr1/2 and Cxcr3 inhibitor (NBI 74330 and CU CPT22) cocktail (O) treated primary OPCs culture. (P) Graph depicting the frequency of different clone sizes in the vehicle (CTR) and Tlr1/2 and Cxcr3 inhibitor cocktail (INH) treated primary OPCs culture. Data are shown as mean ± SEM; each data point represents one animal. p-values are based on Student’s t-test with equal variances. All images are full z-projections of a confocal stack. The level of the cross-section is indicated in the inset. Scale bars in (D,H,J) = 100 μm; scale bars in (N,O) = 50μm, scale bars in (E,E′) = 20 μm; scale bars in (I,K) = 10 μm. Abbreviations: dpi: days post-injury; Veh: vehicle; Inh: inhibitors; OPC: oligodendrocyte progenitor cell. Symbol description: Triangle: skull injury; blue square: uninjured volume; red triangle: vehicle; light blue triangle: double inhibitors, NBI 74330 and CU CPT22; black square: control primary OPCs; red circle: double inhibitor (NBI 74330 and CU CPT22) treated primary OPCs. |
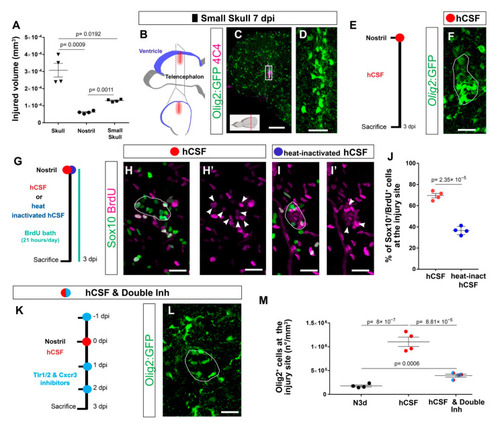
Cerebrospinal fluid-derived molecules induce the proliferation of OPCs and a reactive gliosis-like phenotype. (A) Graph depicting the size of the injured volume after skull, nostril, and small skull injury at 1 dpi. p-values are based on a Welch one-way ANOVA (unequal variances; p-value = 3.034 × 10⁻⁴) with a post-hoc Dunnett T3 test with unequal variances (all pairs). (B) Scheme depicting the small skull injury model. Nostril and small skull injuries were performed with a glass capillary. The red line indicates the dorso-ventral injury through the skull and blue indicates the location of the telencephalic ventricle. (C) Image illustrating the reactivity of Olig2:GFP+ and 4C4+ cells 7 days after small skull injury. (D) Magnification of the oligodendroglial accumulation boxed in (C). (E) Design of the experimental workflow to analyze the effect of human CSF administration. (F) Image illustrating the reactivity of Olig2:GFP+ cells 3 days after nostril injury and hCSF treatment. White line depicts the injury site. (G) Experimental design to analyze the proliferative capacity (BrdU incorporation) of Sox10+ cells after nostril injury at 3 dpi and hCSF or heat-inactivated hCSF administration. (H–I′) Images showing the accumulation of Sox10+ and BrdU+ cells at the nostril injury site after hCSF (H,H′) or heat-inactivated human CSF (I,I′) administration. White lines depict the injury site and white arrowheads the colocalization of BrdU and Sox10. (J) Dot-plot depicting the proportion of Sox10+ and BrdU+ cells accumulating at the nostril injury site after hCSF or heat-inactivated hCSF administration. p-value is based on Student’s t-test with equal variances. (K) Workflow to study the effect of the Tlr1/2 and Cxcr3 inhibitor treatment after human CSF injection. (L) Micrograph of a nostril-injured telencephalon at 3 dpi depicting Olig2:GFP+ cell reactivity following human CSF and inhibitor treatment. The white line depicts the injury site. (M) Graph showing the density of Olig2:GFP+ cells at the injury site at 3 dpi after nostril injury, treatment hCSF, and treatment with hCSF and double-inhibitor. p-values are based on one-way ANOVA (p-value = 1.042 × 10⁻⁶) with post-hoc Tukey Test (all pairs). Data are shown as mean ± SEM; each data point represents one animal. All images are full z-projections of confocal stack. Scale bars in (C) = 100 μm; scale bars in (D,F,H,H′,I, I′,L) = 20 μm. Abbreviations: dpi: days post-injury; hCSF: human cerebrospinal fluid; Inh: inhibitors; N3d; nostril 3 dpi. Symbol description: black triangle: skull injury; black circle: nostril injury; black rectangle: small skull injury; red circle: human CSF administration; blue circle: heat-inactivated hCSF treatment; light blue circle: double inhibitors, NBI 74330 and CU CPT22. |
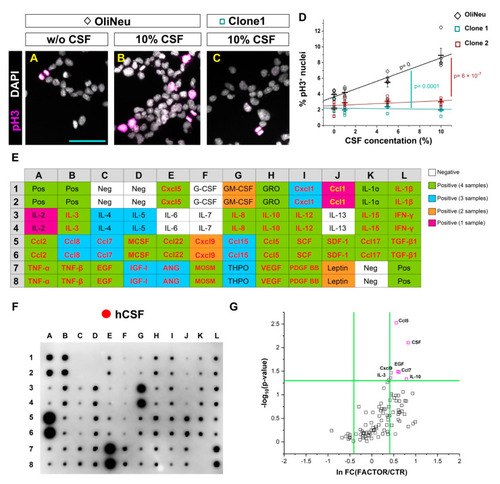
In vitro screening to identify potential candidates from the human cerebrospinal fluid inducing OPC proliferation. (A–C) Micrographs illustrating the proportion of proliferating (pH3 positive) cells in a control wildtype (WT) (A,B) and Tlr2 and Cxcr3-deficient (C) OliNeu oligodendrocyte progenitor cell line in basal conditions (A) and in response to the CSF treatment (B,C). (D) Dot-plot depicting the proportion of proliferating WT and Tlr2 and Cxcr3-deficient Oli-Neu cells after CSF treatment. The line indicates the corresponding linear data-fit. Data are shown as mean ± SEM; each data point represents one independent experiment. Adjusted p-values assess the quality of the linear fit for the WT clone (black) and difference in the slopes of the linear fits (color-coded) using the linear regression model. (E) Table showing the map of the array in (F). Color-code illustrates the presence of each cytokine in CSF samples (White: negative in all samples; Green: positive in all samples; Blue: positive in 3 out 4 samples; Orange: positive in 2 out of 4 samples; Magenta: Positive in 1 out 4 samples). Cytokines names colored in red or yellow were selected for the screening in (G). (F) Representative image of a cytokine antibody array depicting the cytokine composition of a healthy donor-derived CSF. (G) Dot plot depicting proliferation of Oli-Neu cells after treatment with different cytokines and CSF. Scale bars in (A–C) = 50μm Abbreviations: hCSF: human cerebrospinal fluid. Symbol description: Black diamond: control OliNeu cells; green square: Tlr2 and Cxcr3-deficient clone 1; red square Tlr2 and Cxcr3-deficient clone 2; red circle: human CSF administration. |