
Fig. 5.
- ID
- ZDB-FIG-220205-49
- Publication
- Dal et al., 2021 - The zebrafish embryo as an in vivo model for screening nanoparticle-formulated lipophilic anti-tuberculosis compounds
- Other Figures
- All Figure Page
- Back to All Figure Page
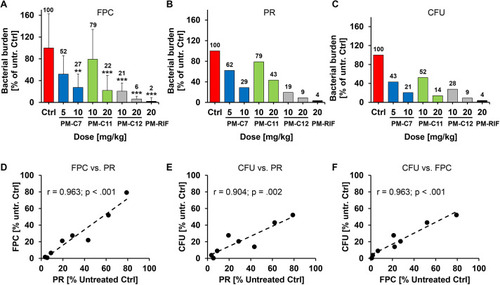
Quantification of bacterial burden in Mm-infected zebrafish embryos after treatment with PM-formulated nNF derivatives by three different methods. Mm-dsRed-infected zebrafish embryos were treated with the indicated doses of the PM-formulated nNF derivates C7, C11, C12 or PM-formulated RIF by intravenous injection, and bacterial burden was quantified at 4 dpt by three different assays. (A) FPC: untreated or treated embryos were imaged and the total bacterial fluorescence intensity was determined by FPC for individual embryos. Data are mean±s.d. of data normalized to the untreated control (ctrl) pooled from at least three independent experiments (Ctrl, n=71; PM-C7 5 mg/kg, n=13, and 10 mg/kg, n=15; PM-C11 10 mg/kg, n=15, and 20 mg/kg, n=18; PM-C12 10 mg/kg, n=45, and 20 mg/kg, n=49; and PM-RIF 20 mg/ml, n=51). **P<0.01, ***P<0.001 (non-parametric Kruskal–Wallis H test followed by post-hoc analysis using Dunn's multiple comparisons test). (B) Plate reader (PR) assay: embryos in each treatment group or the untreated control were pooled and homogenized, and fluorescence intensity was measured using a plate reader. (C) CFU count: bacterial burden was enumerated by plating serial dilutions of the pooled homogenate on 7H10 plates. Results in B and C are shown as a percentage relative to the untreated control and represent data from one experiment. The mean values of each group in A-C are displayed above the columns. (D-F) Correlation between the normalized bacterial burden for all four compounds obtained by the three methods. Linear regression plots comparing FPC with the PR assay (D), CFU with the PR assay (E) and CFU with the FPC assay (F). Pearson's coefficient of correlation (r) with P-value are denoted in the individual figures. |