FIGURE

FIGURE 3

ID
ZDB-FIG-220203-29
Publication
Shu et al., 2022 - The Role of Microtubule Associated Serine/Threonine Kinase 3 Variants in Neurodevelopmental Diseases: Genotype-Phenotype Association
Other Figures
All Figure Page
Back to All Figure Page
FIGURE 3

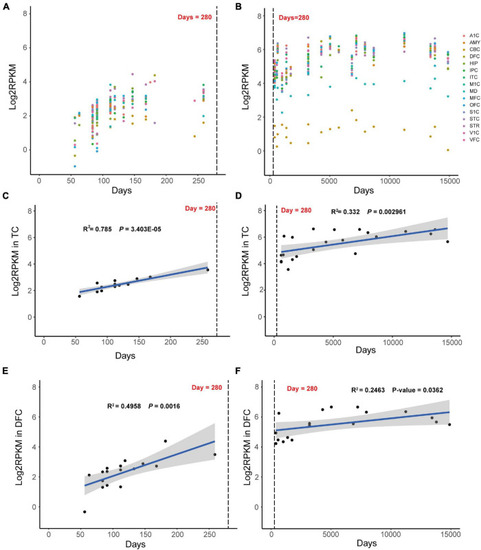
Dynamic expression mode of MAST3 in human development brains. (A,B) Expression of MAST3 during brain development periods in different brain regions. The x-axis is the age of samples in days and y-axis is the log2-transformed RPKM of MAST3. A1C, primary auditory cortex; AMY, amygdaloid complex; CBC, cerebellar cortex; DFC, dorsolateral prefrontal cortex; HIP, hippocampus; IPC, inferior parietal cortex; ITC, inferolateral temporal cortex; M1C, primary motor cortex; MD, mediodorsal nucleus of thalamus; MFC, medial prefrontal cortex; OFC, orbital frontal cortex; S1C, primary somatosensory cortex; STC, superior temporal cortex; STR, striatum; V1C, primary visual cortex; VFC, ventrolateral prefrontal cortex. The dashed line indicates the birthday. (C,D) Expression of MAST3 in the TC region. (E,F) Expression of MAST3 in the DFC region. Univariate regression analysis was applied in prenatal brains (left) and post-natal brains (right), separately. Blue line represents the regression line and the gray region indicates 95% CI. The text shows the R2 and P-value of regression.

Expression Data

Expression Detail
Antibody Labeling
Phenotype Data

Phenotype Detail
Acknowledgments
This image is the copyrighted work of the attributed author or publisher, and ZFIN has permission only to display this image to its users. Additional permissions should be obtained from the applicable author or publisher of the image. Full text @ Front. Mol. Neurosci.