FIGURE SUMMARY
Title

The Role of Microtubule Associated Serine/Threonine Kinase 3 Variants in Neurodevelopmental Diseases: Genotype-Phenotype Association

Authors
Shu, L., Xiao, N., Qin, J., Tian, Q., Zhang, Y., Li, H., Liu, J., Li, Q., Gu, W., Wang, P., Wang, H., Mao, X.
Source
Full text @ Front. Mol. Neurosci.

(A) Sanger sequencing results of c.302C > T in patient 1 trio. (B) Sanger sequencing results of c.311C > T in patient 2 trio. (C) Sanger sequencing results of c.1547T > C in patient 3 trio. (D) Sanger sequencing results of c.1543G > A in patient 4 trio. The arrows pointed to the location of the variants.

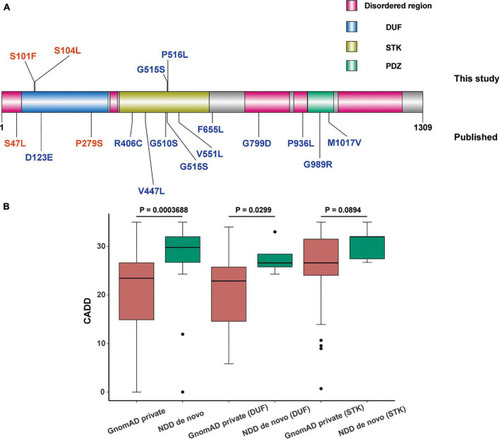
Distribution and comparison of pathogenicity of missense mutations in domain of unknown function (DUF) and serine-threonine kinas (STK) domain of microtubule associated serine/threonine kinase 3 (MAST3). (A) Schematic representation of missense variations in MAST3. Variations above and under the protein domain graph are originated from this study and published research, respectively. The colors in the MAST3 protein represented different protein domains (pink: disordered region, blue: DUF domain, yellow: STK domain, and green: PDZ domain). The different colors of the variants showed different diseases (red, ASD; blue, DD). (B) Box plot of CADD of de novo (neurodevelopmental diseases, NDD)/private (GnomAD) missense mutations in DUF or STK domain. Higher CADD scores of missense variants in total and in DUF region of MAST3 were found in NDD cohort compared with that in gnomAD database (p = 0.0003688, 0.0229, Wilcoxon test). Significance was lost when the same analysis was performed for STK domain variants (p = 0.0894, Wilcoxon test).

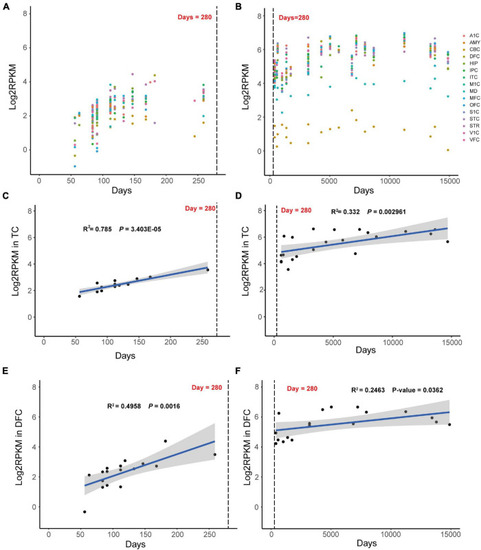
Dynamic expression mode of MAST3 in human development brains. (A,B) Expression of MAST3 during brain development periods in different brain regions. The x-axis is the age of samples in days and y-axis is the log2-transformed RPKM of MAST3. A1C, primary auditory cortex; AMY, amygdaloid complex; CBC, cerebellar cortex; DFC, dorsolateral prefrontal cortex; HIP, hippocampus; IPC, inferior parietal cortex; ITC, inferolateral temporal cortex; M1C, primary motor cortex; MD, mediodorsal nucleus of thalamus; MFC, medial prefrontal cortex; OFC, orbital frontal cortex; S1C, primary somatosensory cortex; STC, superior temporal cortex; STR, striatum; V1C, primary visual cortex; VFC, ventrolateral prefrontal cortex. The dashed line indicates the birthday. (C,D) Expression of MAST3 in the TC region. (E,F) Expression of MAST3 in the DFC region. Univariate regression analysis was applied in prenatal brains (left) and post-natal brains (right), separately. Blue line represents the regression line and the gray region indicates 95% CI. The text shows the R2 and P-value of regression.

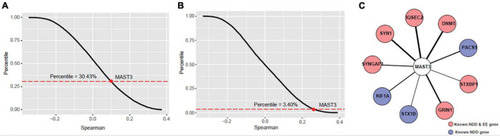
Co-expression analyses of microtubule associated serine/threonine kinase 3 (MAST3) with EE and NDD genes. (A,B) The percentile of average correlation coefficient for all developing cortex expressed genes with NDD (A) or EE (B) genes. The average percentile of MAST3 was marked. (C) Interaction network contains nine highly co-expressed EE/NDD genes (Spearman’s correlation coefficient > 0.7) with MAST3.

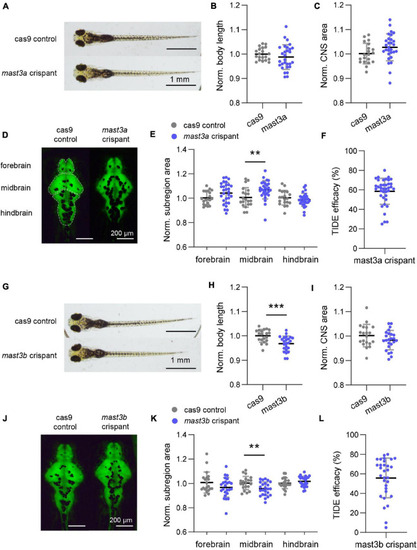
Disruption of zebrafish mast3a and mast3b led to abnormal central nervous system (CNS) morphology. (A) Representative bright-field imaging of larval zebrafish at six dpf (dorsal view). Top, cas9 injected control; bottom, mast3a F0 CRISPR (crispant). (B) Measurements of body length in cas9 injected control (n = 20 fish) vs. mast3a crispant (n = 29 fish). Data were normalized to the average body length of cas9 control group. (C) Normalized CNS area in cas9 injected controls vs. mast3a crispants. Data were corrected by the normalized body length of individual larvae. (D) Representative imaging of HuC: eGFP expressed larval zebrafish shows CNS fluorescence pattern at six dpf (dorsal view). Left, cas9 injected control; right, mast3a crispant. White dash line highlights the CNS subregions, forebrain, midbrain, and hindbrain, for measurement. (E) Normalized CNS subregion area in cas9 injected control vs. mast3a crispant. Data were normalized to the average of each subregion area of cas9 control group, and then corrected by the normalized body length of individual larvae (gray dot, cas9 control; blue dot, mast3a crispant). (F) CRISPR efficacy calculated via TIDE method of individual mast3a crispant used in phenotypic study (n = 38 fish). (G–L) Data from mast3b crispant study (for imaging study, n = 20 fish for cas9 control, and n = 24 fish for mast3b crispant; n = 31 crispant for TIDE efficacy verification). Scale bars as indicated in the figure. Error bars indicate SD. Statistical significance is indicated as **p < 0.01, and ***p < 0.001.

Acknowledgments
This image is the copyrighted work of the attributed author or publisher, and ZFIN has permission only to display this image to its users. Additional permissions should be obtained from the applicable author or publisher of the image. Full text @ Front. Mol. Neurosci.