
Fig 5
- ID
- ZDB-FIG-220131-43
- Publication
- Reddy et al., 2022 - A lexical approach for identifying behavioural action sequences
- Other Figures
- All Figure Page
- Back to All Figure Page
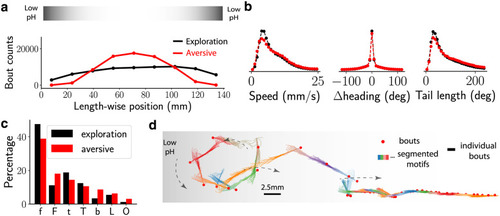
(a) Histogram of larvae positions along the well with and without the aversive (acidic) gradient, located at the ends of the well. The s.e.m is square-root of the counts, which is negligible. An illustration of the aversive gradient is shown above. (b) The distribution of speed, change in heading and the summed tail angle of all bouts during exploration (black) and in aversive environment (red). The difference in global kinematic parameters between the two environments is small. (c) The fraction of each bout type in exploratory and aversive environments, where a total of ≈ 85000 and ≈ 66000 bouts were collected respectively, shows an increase in fast bouts: b,F and O. (d) Localisation of bout types along the well with and without the aversive (acidic) gradient, (e) BASS segments a series of bouts from the aversive environment into sequence of recurring motifs. Shown here is a sample trajectory (as in Fig 4b) where the fish escapes from the aversive environment. |