
Fig. 2
- ID
- ZDB-FIG-220131-272
- Publication
- Ziegler et al., 2021 - Mandipropamid as a chemical inducer of proximity for in vivo applications
- Other Figures
- All Figure Page
- Back to All Figure Page
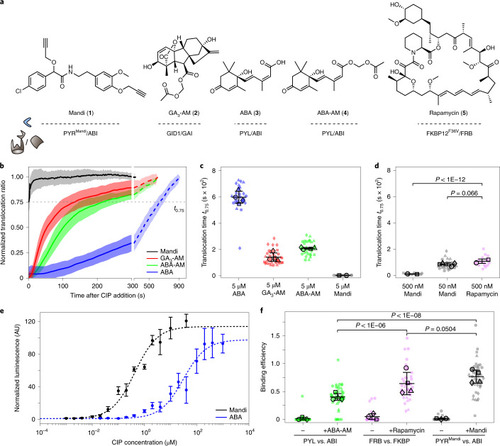
Quantitative comparison of the new Mandi system with existing CIP systems.
a, Chemical structure of different CIP systems and their respective receptor and receiver domains. b, Single-cell translocation kinetics of the cytosolic receiver domain to the receptor domain localized on mitochondria. Trajectories were normalized to ratios before CIP addition and after translocation was completed. Data represent mean (line) ± s.d. (shaded region). See Supplementary Table 2 for number of cells and experiments. CIPs were injected at a 5 µM final concentration at t = 0 s. The translocation time, t0.75, is indicated by the dashed line. See Supplementary Fig. 4 for single-cell translocation trajectories and Supplementary Fig. 5 for averaged trajectories from experiments with reduced Mandi concentrations. c,d, Translocation times for different CIPs and CIP concentrations. Small symbols represent individual cells, and large symbols represent means from experiments. See Supplementary Table 2 for the number of cells and experiments for each condition. The means ± s.d. across experiments are indicated by error bars. e, Dose–response (median ± s.d.) of ABA- or Mandi-induced luciferase expression in COS-7 cells after 24 h of incubation. Four (7) samples from three (4) independent experiments for Mandi (ABA-AM). f, Binding efficiencies from RSICS experiments before and after CIP addition at a 500 nM final concentration. Lines indicate mean ± s.d., and symbols are as described in c. Conditions were compared using a two-sided unpaired t-test with Welch’s correction. Source data |