
FIGURE
Fig. 3
- ID
- ZDB-FIG-220125-4
- Publication
- Atieh et al., 2021 - Protocol for quantitative analysis of pulsatile contractions and cell extrusion in epithelial tissues of larval zebrafish
- Other Figures
- All Figure Page
- Back to All Figure Page
Fig. 3
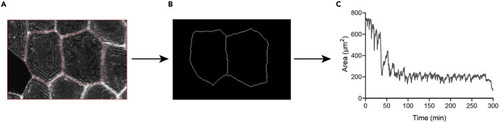
(A) Cell-cell Bond detection after correction. (B) Segmented processed image. (C) Scatter dot graph representing a single cell example of the area fluctuation overtime of an epithelial cell. |
Expression Data
Expression Detail
Antibody Labeling
Phenotype Data
Phenotype Detail
Acknowledgments
This image is the copyrighted work of the attributed author or publisher, and
ZFIN has permission only to display this image to its users.
Additional permissions should be obtained from the applicable author or publisher of the image.
Full text @ STAR Protoc