
- Title
-
Protocol for quantitative analysis of pulsatile contractions and cell extrusion in epithelial tissues of larval zebrafish
- Authors
- Atieh, Y., Ruiz, O.E., Eisenhoffer, G.T.
- Source
- Full text @ STAR Protoc

(A) Zebrafish larvae mounted in a glass bottom MatTek dish with one compartment. Scale bar, 5 mm. (B) Zebrafish larvae mounted in a glass bottom Greiner dish with 4 compartments. Scale bar, 5 mm. |

(A) Maximum intensity projection of epithelial cells in the tail fin using a 20× air objective (for multi-positional acquisition). Scale bar, 20 μm. (B) Maximum intensity projection of epithelial cells using a 40× water objective (for high-resolution acquisition). Scale bar, 20 μm. Epithelial cells express Nitroreductase (NTR-mCherry, shown in magenta) and Lifeact-EGFP (green). |
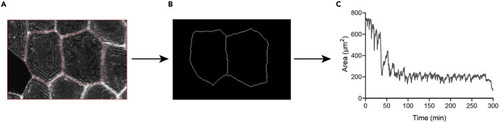
(A) Cell-cell Bond detection after correction. (B) Segmented processed image. (C) Scatter dot graph representing a single cell example of the area fluctuation overtime of an epithelial cell. |
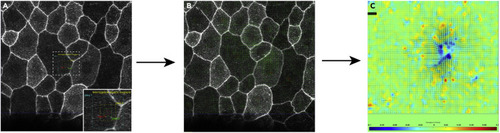
(A) Setting passes and interrogation windows. (B) PIV analysis after selection of velocity limits. (C) Convergence/Divergence (i.e., cellular contraction/expansion) colormap as generated by the software. |