
Fig. 4
- ID
- ZDB-FIG-211230-36
- Publication
- Fadul et al., 2021 - KRas-transformed epithelia cells invade and partially dedifferentiate by basal cell extrusion
- Other Figures
- All Figure Page
- Back to All Figure Page
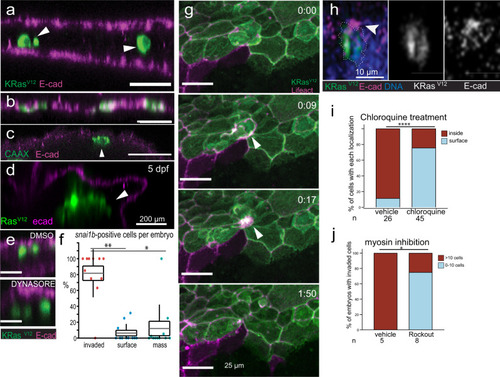
KRasV12 cells invade by BCE and shed apical epithelial determinants.
XZ sections of 48 hpf EGFP-dt-KRasV12 embryos with E-cadherin– internalized cells (a, arrowheads) and EGFP-CAAX embryos, where cells remaining at epidermis and are E-cadherin+ but the few that internalize are E-cadherin– (b, c, arrowhead). Those in an internal cell mass (T2A-KRasV12, arrowhead) at 5 dpf also lacks E-cadherin (d). e XZ sections of DMSO or 100 μM Dynasore-treated T2A-KRas V12/p53 MO-injected embryos showing internalized cells lack E-cadherin (arrowheads). f Percentage of invaded, surface, or mass-associated snai1b+ cells in 14 embryos, *P < 0.05, **P < 0.01 by a Friedman test and Wilcoxon signed-rank test with the Holm-Sidak adjustment for pairwise comparisons, n = 11 embryos. Data are represented as boxplots where the middle (grey) line is the mean, the hinges indicate ±SEM, and the whiskers indicate ±SD. All data points are shown. g Stills from Supplementary Movie 16 showing BCE of a EGFP-dt-KRasV12 cell in a periderm:Lifeact-mCherry line (arrowheads pointing to ring contracting), clipping off the apex (green). h XZ-section of a basally extruding EGFP-T2A-KRasV12 cell (dashed) with E-cadherin constricted apically (arrowhead). Analysis of invasion in vehicle versus chloroquine-treated (i) or Rockout-treated (j) embryos at 48 hpf, ***P < 0.001, *P < 0.05 by a Fisher Exact Test. Source data are provided as a Source Data file. |