
Figure 3
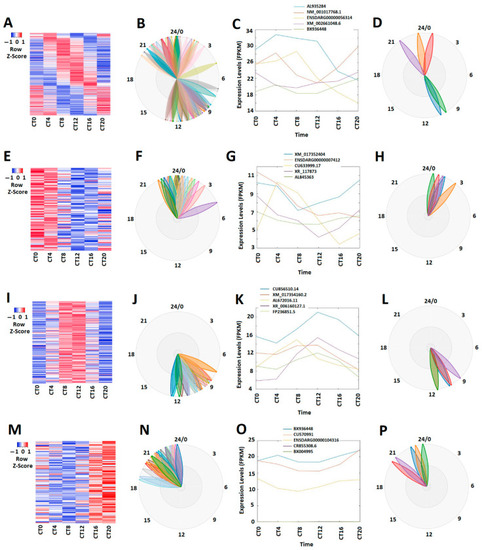
Expression profile analysis circadianly expressed zebrafish larval lncRNAs under the LL condition. (A–D) Analysis of all the 309 circadianly expressed larval lncRNAs under the DD condition. Heat map (A) and BioDare2 plots (B) of all 309 the circadianly expressed larval lncRNAs, expression profiles (C) and BioDare2 plots (D) of representative lncRNAs. (E-H) Analysis of the 78 larval morning (CT0 and CT4) lncRNAs. Heat map (E) and BioDare2 plots (F) of the 78 larval morning lncRNAs, expression profiles (G) and BioDare2 plots (H) of larval morning representative lncRNAs. (I–L) Analysis of 144 larval evening (CT8 and CT12) lncRNAs. Heat map (I) and BioDare2 plots (J) of 144 larval evening lncRNAs, expression profiles (K) and BioDare2 plots (L) of larval evening representative lncRNAs. (M–P) Analysis of 87 larval night (CT16 and CT20) lncRNAs. Heat map (M) and BioDare2 plots (N) of 87 larval night lncRNAs, expression profiles (O) and BioDare2 plots (P) of larval night representative lncRNAs. |